Monday, July 29, 2019

RSI - Shooting higher and higher!!!

Present RSI of the All Share Index and many other stocks are way too high, but doesn't seem like retracing any time soon.

Therefore we need to understand this behaviour in line with our Market, than sticking to the theories or lessons learnt in other Markets.

A Chart of the index or a stock resembles the HIGH WAY.

The Index or the Stock is your CAR (vehicle)
Price behaves like the ENTRY/EXIT POINTS also TRAFFIC JAMS in the High Way.

Volumes act as the Good and Bad ENERGY of the one who drives (Trader/Investor - aka Bulls and Bears) the CAR.

RSI behaves as the SPEEDO - METER of the Vehicle.

When the Driver gets into a CAR called AEL at the ENTRY POINT of 12.00 around 14th - 17th of May 2019, the SPEEDO - METER the RSI was at 24, the DRIVER started gathering ENERGY by accumulating the Bullish Volumes (reflected in Green in the Volumes Bars), and Speeds up. The SPEEDO-METER the RSI, thereby passing the EXIT POINTS (the Prices) to get stuck in a Traffic of 14.40 on the 17th of June 2019. At this point the SPEEDO-METER the RSI was at 78. But he got stuck in a TRAFFIC JAM. However at each EXIT POINT the DRIVER did not exit but charged his ENERGY of Volumes by consuming Green Volumes. We can see the Driver getting exhausted at times by seeing his ENERGY receiving RED volumes, yet his GREEN Volumes over powered that.

After hitting the Traffic Jam at 14.40 the DRIVER retraced towards the ENTRY POINT of 13/60 on the 24th of June 2019, at which point the SPEEDO - METER too had come down towards 67 points. With the renewed ENERGY of Green volumes the DRIVER successfully speeds up towards 17.30 with minor traffic jams around 14.80, 15.30, and 16.30. He reached the 17.30 PIONT on the 17th of July 2019. The SPEEDO-METER the RSI has now reached 86.

The Driver encountered another somewhat prolonged Traffic Jam at this point with a fairly high speed as the SPEEDO - METER the RSI dropped only to 77 on the 22nd of July at the 16.30 POINT. The Driver loaded himself with more ENERGY of Green Volumes during this period. From there on the Driver of AEL propelled his car to reach 19.50 on the 29th of July, at a speed of almost 91. Along the way he has accumulated more and more GREEN VOLUMES of ENERGY.

Going forward the DRIVER may encounter a Traffic Jam. But before that with the available ENERGY he could reach a POINT between 20 and 21. Ofcourse the Driver has to slow down, but with the strength he has consumed with Volumes of Energy he could try to speed up and reach those POINTS of 20 and 21. This must happen in the next 2 to 3 days. Else another Traffic Jam!!!


No one will tell you about the Art of Investing

Many of our Parents, Teachers,Scholars, Priests, Monks, Swamis, Political Leaders,
Intellectuals, Pundits etc.,have told us how to build wealth. They have told us that
we need to have money in the Bank, Study well, find a good job in a good
industry or sector, go abroad and make a living, build a nice house, buy lands,
buy a brand new car, try to buy cars for you and your family members.
Also have dreams based on these goals and so on. So from Small days you
are tuned to do a good job in a great industry and earn a big salary to achieve most of
the above. How many of them have ever told you about the most successful way of 
Earning and Increasing wealth through the Stock Market??? Almost none.
Those who hear about the Stock Market start investing only when the prices are way too high.
Then they bad mouth about it. But there are a few who have discovered the Art of Investing
in the Stock Market. Explore it at the right time. Come Join Us. Be informed. Learn the
Art, Learn the Plans, Learn the Strategies, help others to do so. Once you start doing it the
right way, you will discover how LUCKY you are.... 
Please share this link and help others too.

Sunday, July 28, 2019

Are you looking how to Buy Stocks Now? Try the RCA and RVA Strategy

Firstly I must mention that this post is not for every one. Because you need patience and the ability to understand these very simple methods of buying shares with discipline. If you do not posses both PATIENCE and DISCIPLINE then I think it is better to do something else with your valuable time.


  • Interest Rates have started to fall. 
  • Election Effect is bringing in a lot of speculation. 
  • Prices have fallen disproportionately against valuations.

These key events have taken the Market up from a low of 5199 to the present level of 5870.

Are you looking to Buy now?
Have You started buying and don't now how to move forward?
Have you bought and sold at good profits, and waiting to get in?

THESE STRATEGIES ARE FOR ALL.

Let's discuss RCA first and then move to RVA.

What is RCA STRATEGY?

RCA stands for RUPEE COST AVERAGING.

Firstly you must decide to select your stock.
Then you must invest an equal amount each time you invest into that Stock. Let's say the fixed amount is Rs.10,000/=. That will be the amount you will invest for each lot every time you buy.

eg: 1st Lot - 10k, 2nd Lot - 10k, 3rd Lot - 10k etc.


There are millions of ways of doing this.

Good thing in this strategy is that you will invest a fixed amount each time you buy each lot of shares.

When to buy can be daily, once in two days, every week, every month or any way you want.

Even the amount can be any amount. It is best if you invest something that you will keep adding on effortlessly. Remember it is you who will benefit from this. It is your wealth that will increase, not mine.

In this Strategy you will buy more shares when the price is down, and lesser amount when the price is high.

If the price is 10, and you invest 10k. You will buy 1000 shares. If the price is 5 and you invest the equal amount of 10k. Then you will buy 2000 shares. So you have 3000 shares with 20k. At an Average of 6.67 per share. If you used that 20k all at once, then you would have bought 2000 k at 10, and the average will be 10 per share.

If the price went upto 12.5 the 3 rd time you wanted to invest 10k, then you will buy a lesser number of shares i.e. 800.
After 3 times you will have 3800 for a 30k investment, averaging 7.90.


What is RVA?

RVA is Rupee Value Averaging. It is a very simple strategy to put your money ANY time you want to Buy Shares like the RCA Strategy.

There is a slight difference from the RCA Strategy though.

In RCA we invest a fixed amount every time. In the RVA strategy you invest a fixed amount first and check the portfolio value and decide the amount you invest to have a final total of the fixed amount. If the prices have gone up over and above the invested value and you do not need to add more, then you stop and could even take the gains out.

Let's take the same share prices given in the RCA example and see how the RVA strategy works.

3 share price levels were 10, 5 and 12.50 per share.

So you invest the first 10k at 10. Then you have 1000 shares.
Next time the share fall to 5, as such your portfolio value is 5 into 1000 shares. That is a value of 5000.
Then in order to make it upto 20k, you need to put in 15k, and buy 3000 shares.
Now you have 4000 shares with the 20k that's invested.
Next time the stock price has gone to 12.5, and your portfolio value is 4000 into 12.50 = 50,000/=.
Therefore you do not need to put the next fixed amount of 10k.
Which means that at this point you have only invested 20k and the portfolio value has moved to 50k, giving a gain of 30k.

I do not expect you to understand it when you read it for the first time. I know you need help to understand it.

If you want to know more about these 2 strategies please call me/text me/whatsapp  on 0773219506. Just because you call me doesn't mean that I am asking you to move your portfolio to me.

Please note that my sole intention here is to see you trade and invest to a well thought out plan, and make you move forward with confidence.

There is an excel working on both these strategies(I do not want to share it on google sheets). If you are interested to have it please send me a mail to saliya@capitaltrust.lk. I will be more than happy to share it and also help you to understand it and use. Send me the mail with the following heading : RCA vs RVA excel sheet.

Finally I think I explained the strategies and said will go out of my way to make you an informed trader or investor. If you have read thus far and yet do not want my help, I do not know what to say.


Friday, July 26, 2019

ASI Weekly Report - Highest weekly increase for 2019

CSE All share Index closed higher for the 4th week in a row, breaking another record with the highest weekly increase of 228 points from a low of 5656 to a high of 5884 points. Number of trades too were the highest for the Year in an up-trending market. Weekly trades were 43,154 over the previous weeks number of 30,418.

There were 29 Counters with 300+ trades, whilst 15 of them were 500+, and 3 Counters had trades over 1000. Incidentally AEL topped the list with 1942 trades.

Along the way the ASI broke the major levels of 5800, and 5850 with strength.


Obviously the Market is on fire. The Bulls aren't leaving any room for the Bears to take control. On the last 3 days of the week we saw moments of Bear Power, but the Bulls wiped them out of sight. Can the Bulls take away the 5900 and 6000 points by next week?

Hourly RSI is in the overbought area just like in the Daily Chart, but there had been pull backs testing the 48 point area to extend the trend again with much vigour.

It is natural for any one who watches the Market behaviour to expect a correction, but the bullish sentiments prevailing in the market makes that expectation to move in to the back seat.

The biggest and the most important fundamental event is certainly the falling Deposit and Lending Rates. But we can not turn our faces back to the biggest driver of sentiments of the Sri Lankan Population i.e. the Politics in the midst of the Presidential election. This has found its way into the Market where Traders having different political views are siding with Bulls and Bears in the Market. As such they are risking millions based on their own theories.

This has made the investment decisions of Investors who base their investments of lowering rates and better Corporate performances, to mop up some sizes of their positions too.

Experience have shown that any euphoric behaviour needs a cooling off. Therefore both traders and investors in my opinion must follow a Buy on Dips Strategy, only if they believe that the overall market is in an upward trajectory with dips or sideway movements or consolidations or what ever you call it. It is always profitable to stick with profitable counters with strong fundamentals. But need to always remember that Stock Prices fall for reasons beyond your control. Therefore be humble enough to cut loss base on your level of risk.

Friday, July 19, 2019

ASI Weekly Report - 1st phase of the present trend - Read till the end!!!

If you decided to read this post. DO IT TILL THE END. It will be useful for your trading/investing life.

Colombo Stock market ended the week with an extension of the trend further. On the 16th of May '19, the ASI reported the present low of 5198.95. Market ended on Friday with a close of 5715.14. But the intra-day high was 5724.13. 16th of May to the 19th of July'19 there had been 44 market days, and the ASI has shown an increase of 524.18 points, almost 12 points a day.  Previous run of this type was in 2017, from the 28th of March 2017 to 14th of July 2017. During a period of 70 days the ASI went up from a low of 5968 to a high of 6769, which is an increase of 801 points. That is an average of 11.4 points a day. We see in 2016, that the market increased by 916 points in 43 days, with an average of 21 points.

During these 3 phases of the ASI within these 3 years, it is interesting to see what happened to the RSI.

In 2016 rally the RSI extended from a low of 11.6 points to a high of 83.1. As shown in the following chart covering this period, you will notice how the RSI has slowed down as against trend extension of the ASI.


In 2017 rally, where the index increased by 801 points in a total of 70 days, the RSI increased from a low of 24.6 points to a high of 83.6 in just 11 days from 28th of March to the 12th of April. In this period the index went up from a low of 5968 to a high of 6421 points.  The 2nd phase starts at a low of  6351 on the 18th of April 2017, and increased to a high of 6769 points. But the RSI went down from a high of 83 points to close at 56 points. This is known as a bearish convergences show an in the following chart.


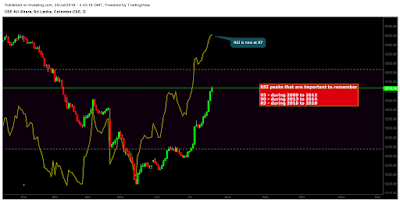
The week ended on the 19th instant the RSI closed at 87 points. However the RSI peaks since 2009 todate have been around 83, 90 and 93. Hence the 87 is only above 83 points, which was the highest during 2016 to 2018 period. The following chart shows that.  This can be called the 1st phase of the present trend.


The number of trades that recorded during the week just ended was 30,418 against a figure of 22,778. This shows the bullish sentiment that is visible in the market. The number of counters with over 300 trades increased too, from 15 to 21 during the week. Counters with 500+ trades edged down to 8 from 10 over the previous week. There were 2 counters with 1000+ trades, out of which AEL saw 1000+ trades for the 3rd week in a row. The other was BIL with renewed energy and hope.


For those who want to follow the herd and rumours, NO ONE CAN HELP. We have to commend the ones who are risking millions of rupees and acting as UN OFFICIAL MARKET MAKERS. They too need exit strategies, but the past experience have suggested to us that these TREND SETTERS, either get branded as manipulators or get caught for forced selling due to them being compelled to defend and keep the euphoric momentum they themselves are creating. 

For the desciplined traders and investors who are manoeuvring  within these undercurrents, will certainly see great opportunities, that can be turned into moments of glory!!!


Thursday, July 18, 2019

GW strategy

1992 Mr. GW කියල investor කෙනෙක් මට හම්බ වෙනවා. මේ තැනැත්තා Marine Engineer කෙනෙක්. ඒ නිසා එයා වැඩි පුර ඉන්නෙ මුහුදෙ. නෝනා දරුවො දෙන්න බලා ගෙන ගෙදර ඉන්නවා. දවසක් මෙයා ගෙදර ආවම දැන ගන්නවා නෝන ට අනියම් සම්බන්ධයක් තියෙනවා කියල. වයස 10 ක් විතර දුවයි 7ක් විතර පුතයි මෙයාගේ භාරයට ඇර ගෙන නෝන ගෙන් මෙයා වෙන් වෙනවා.
ඊට පස්සෙ මෙයා නැවේ වැඩට යන එක නතර කරනවා. නතර කරලා දරුවො දෙන්නව බලාගෙන ගෙදර ඉන්නවා. දරුවන් දෙන්නව ඉස්කොලේ යවලා (රටේ තියෙන සුපිරි ඉස්කෝල දෙකක), එයා යනවා මු⁣හුදේ beach run එකකට. ඊට පස්සෙ wash එකක් දාලා උදේ 10 ට විතර එනවා අපේ office එකට. ඒ වෙන කොට market එකේ busy time එක ඉවර වෙලා, ගොඩක් අය rest කරනවා. මේ වෙලාවට ගොඩක් දෙනා උදේ තේ එක බොන වෙලාව. ගොඩක් දෙනාගේ අවදානම shares වලින් වෙන දේවල් වලට ගිහින්. මෙයත් තේ එකක් තොල කටගා ගෙන shares ගන්න හා විකුණන්න පටන් ගන්නවා. එතුමාගේ Investment strategy එක අපි කාටත් වටින නිසා පහතින් සටහන් කරනවා. ඊට පලමුව කියන්න ඕනෙ මෙයා හොඳට සල්ලි තියෙන කෙනෙක්. ඒත් සල්ලි නිකන් වීසි කලේ නැහැ.

GW strategy

1. තමන්ගෙ මාසික වියදමට සරිලන විදියට ඔහුගේ වත්කමෙන් ප්‍රමාණයක් fd එකක දානවා.
2. ඉතිරි ප්‍රමාණය කොටස්වල invest කරනවා.
3. Market එකේ එයාට ආවෙනික සමාගම් වලට ආයොජනය කරන එක තමයි එයා කැමති. වෙන අය මොනවා ගත්තත්, ඒ කියන්නෙ රැල්ලට යන අය මොන කොටසක් ගත්තත්, එයා ගන්නෙ එයාගේ list එකෙ shares විතරයි.
4. සමාගමක කොටස් දහස් ගනන් ගන්න පුළුවන් හැකියාවක් තිබුනත්, ගන්නෙ 50,100,200 හෝ වැඩිම වුනොත් 300.
5. ඉන් පස්සේ ඒ ගත්ත සමාගමෙ කොටස් එක්කහු කරනවා.
5. දාන්නේ GTC orders. සහා market price එකට වඩා අඩුවෙන් ඒ orders දානවා. නිතරම shares 50 හෝ 100 එක order එකට දානවා. උදාහරණයක් හැටියට ඒයා UBC එකතු කරනවා නම්. Share එකක market price එක 12.30 නම්, 11/90 ගණනෙ 50, 11/70 ගානේ 50, 11/50 ගානේ 50, 11/00 ගනනේ 100 වගේ orders දානවා. ඒ buy orders.
6. Sell orders දාන්නෙත් මේ විදිහටමයි. එයාගේ Sampath average එක 140/= නම්, 155 ගානේ 50, 158/= ගානේ 50, 160/= ගානේ 50ක්, 165 ගානේ 100ක් වගේ orders දානවා.

එතුමා මට හම්බවෙනකොට අවු 47, අද අවු 74. පුතා කොටිපති ව්‍යාපාරිකයෙක්. ඔහුගේ business එක පටන් ගන්න මුදල් ආයෝජනය කලේ මේ තාත්තයි. දුව professional banker කෙනෙක්. ඇයට ගෙදර හදන්න මුදල් වලින් උදව් කලේ මේ අපූරු මිනිසායි.

වයසින් මුහුකුරා ගිය මේ අනර්ග ආයෝජකියින්ට සාපේක්ෂව අද ඉන්න අයගෙන් මෙවැනි අය මුන ගැසීම හරි විරලයි. මම අදටත් හොයන්නෙ මේවගේ ආයොජකයින්. අඩු ගානේ මේ ලිපියෙන් කවුරු හරි ප්‍රයෝජනයක් ඇරගෙන consistent strategy එකක් එක්ක දිගුකාලීන ආයොජනයට අවතීර්ණ වන්න කියා පතනවා.
අවසානය දක්වා ලිපිය කියෙව්ව ඔයාට මම සුභ පතනවා එවැනි කෙනෙක් වේවායි කියා.

ASI as at 18.07.2019

ASI is now overbought. That's understandable. Yet new buyers need to be aware of the risk. As for the weekly chart the following image shows the resistance lines to watch. Until the behaviour at those levels we must not act against the trend.


Sunday, July 14, 2019

Saturday, July 13, 2019

ASI showed the biggest jump for the Year

CSE All Share Index showed the biggest increase for 2019. But it was not in the week just ended, this happened during the previous week that ended on the 5th of July 2019. ASI moved from a low of 5366 to 5543 points, during that week.  That is an increase of 177 points. Furthermore the number of Trades for the week increased to 23k from 11k during. 15 Counters had trades over 300, and 10 with over 500 trades. There were 2 counters with over 1k trades. They were Sampath Bank Plc with 1434 trades, and AEL with 1023 trades.

During the week just ended on the 12th instant, the Index had a low of 5498, and a high of 5579, finally closing at 5569.90. Increase of 81 points from the low to the high. Number of trades came down though, from 23k to 22k. 15 counters had over 300 trades just like the previous week, while 7 of them had 500+ trades. Only AEL had trades over 1k with 1471. LIOC came close with 980 trades.

The above numbers show that the ASI had recorded an increase of 213 points from a low of 5366 to a high of 5579. This could move into a consolidation, which will determine the way forward.

The following developments have increased attention and brought Investors and Traders back Moderately.

1. EPF returned in to the market after ages.
2. Rate cut by the CBSL.
3. Reduction of the Deposit ceiling by the CBSL for the next 6 months.
4. 4+ years of Bear market bringing down stock prices disproportionately.
5. Pre and Post Election rally.
6. Sentiment change with announcements of candidates.
7. June earnings season that will kick in any time soon.

Any consolidation in the Market and your favourite counters are great opportunities to Buy on Dips.


Loss and Gain of the ASI in 2021 vs the Loss in 2022

  This ASI chart shows the All time high in 2021 of 9025.82 on the 29th 0f Jan'21 and the fall to the yearly low of 6852.64 on the 19th ...