Sunday, January 31, 2016

Swing Trade - John Keells Holdings Plc

Enter at 154.60.
Exit at 164.50.
Stop at 150.10.
Nett Gain is 4.7%
Nett Loss if stopped is 4.5%


Friday, January 29, 2016

Important...... If you want short term trades!!!

IF YOU WANT TO TRADE SHORT TERM READ THIS TILL THE END, IT WONT TAKE 5 MINUTES. 

Some time ago I mentioned about the Swing High and the Swing Low. Spotting them are very important to trade. If spotted at the right time makes you a SURE WINNER.

We had some swing low opportunities when the Market nose dived at the beginning of the year till the 19th. Then what happened? it turned, and still going up. When some of you asked me whether to buy I said wait, why? because if that low was the end of the down trend then we will have safe and better  chances in the next uptrend.

But lets brush up and get ready to TRADE WITH SWING LOWS AND SWING HIGHS.

Swing low is the lowest low on the 2nd day within 3 days, Swing high is the highest high on the 2nd day within 3 days. That is not the real definition but this way it is easy to remember. When the swing low has happened you BUY on the 4th day. If you can buy at a price within the range of the 3rd day it will be great, but sometimes you may have to take the risk of buying even a little higher. Then when do you sell? In a typical swing trade you wait for the swing high to occur, but I tell you to take a % of profits. May be you sell half of what you bought at that % profit , and wait to sell the  next half at the swing high when it occurs.

Now lets take an example.

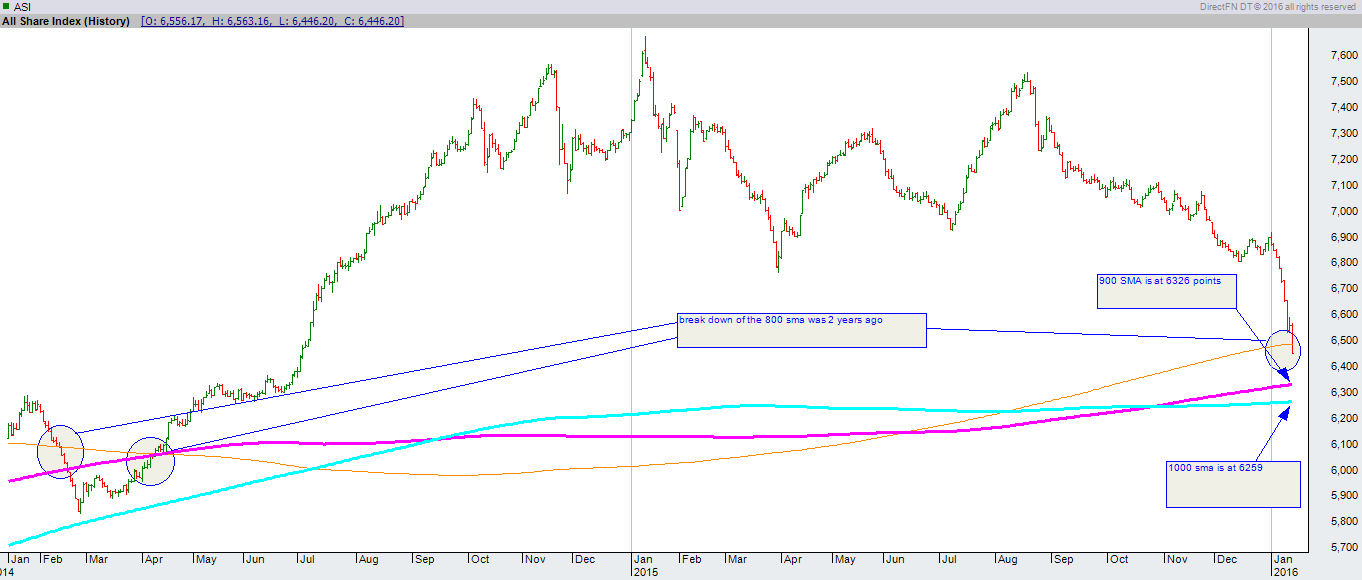
Grain Elevators dropped with the market till the 19th and then rallied. The low of the 18th was 72.10, the low of the 19th was 62.00, then the low of the 20th was 69.00. Thus the swing low was formed. We buy on the 4th day. At what price? between the price range of the 20th. That is between 69 and 75.50. The 21st was the 4th day and you could have bought a decent amount between 72 and 75.50 during that day. Once you bought you must have the guts to sell on the swing low of 62.00, which is your stop loss. If you have bought between 72.00 and 75.50, you could have sold them by now as it went up over 86.00 yesterday, that was 6 market days. If you had bought at 75.50, then you would have made a profit of 9.17 after cost or 12%.  OK why I'm telling this now without doing it at that time. The reason was that I want to see whether the market is staying above the lowest of the 19th, which was 6235 points. As long as we are above that then the Market will give us many more swing trades in time to come. Grain Elevators is only one example, because there were many like that happened on the 19th. BFL, TAFL, TJL, AEL, PLC, PARQ, ALUF are some that saw swing lows on the 19th. They too would have given some decent returns. So let's watch and keep reading my posts, as and when I talk about Swing trading opportunities in the market.

Wednesday, January 27, 2016

Commercial Bank - Below 1000 sma, and down 35.6% from the high of Rs.194.00

Based on the adjusted price history of the Commercial Bank Plc from 2003 todate, the highest % drop had occurred during 2007 and 2008 period. The stock had taken a plunge of 61.6% during a painful period of more than 23 months. That was during the dismal period of LTTE activities and the World Financial Crisis.
There after during 2010 and 2011, it had dropped by 34.37% from 27.10.2010 to 25.11.2011. But the present % drop is 35.6%, making it the 2nd biggest. The interesting point is that the present fall had taken only 12 months, whilst the aforesaid 34.37% drop took 22 months. The largest fall of 61.6% had taken 1 months more of 23 months. The next important point is that the stock had plunged below 1000sma and have not closed above at the present time. It had come down the 1000 sma last was in 2008. As such Com bank will be in my watch list.

FiboWorks Trade Setup - GRAN.N.0000

Trading with fibonacci retracements is an effective strategy in the Colombo Market. Prices on Grain Elevators took a beating from the 4th of Jan 2016 alongside the ASI fall. But made a pull back on the 20th instant. The high within this period was 92.00 and the low being 62.00. That was a fall of 30.00 or 32.6% From the low it recovered to move up to 86.50 i.e. 39.5% recovery. Now we see a consolidation with a support at 81.00.


 If we see the price fall back below 80.50 and then close above 80.50 it will be an interesting point to enter, to exit at 1 rupee below the present resistance of 92.00, with a stop at 73.50. IF the stock fail to move up after falling through 80.50, then we must wait to see it falling to 77.00, and recover to close above that. At which point we can enter to exit at 88.50, with a stop at 69.20.

Performance of Trades that are completed

As at 21.07.2016


ASI failled to rally above 6409.43. Will hit new lows if it fails to hold above 6235.13

The plunge of the ASI resuscitated once it hit a bottom of 6235.13, making it the present swing low. Thereafter it edged up vigorously to hit a high of 6409.43. A recovery of 174.30 points in 2 days, which was an area of the 50% Fibonacci between 4th Jan to 19th Jan down. However we now can see the index could not hold above the 1000sma, and had failed to hold above the present trend line on the intra-day chart.. This is not good for the market. As such we need to see the ASI hold above 6235.13 to hope for a positive momentum.

Thursday, January 21, 2016

ASI has taken support at 1000 sma.........still not enough

A sigh of relief for the bulls as the index stayed higher than the lower low of 6235.15 for two days now. Also the performance of the index today showed some sort of a strength through out the day, but the end of day did not close higher. However an uptrend in the morning sessions of tomorrow can be expected. Since the Market's recovery had been only for 2 days, things can not be described as healthy just yet. Fibonacci retracement from the recent high of 6587.24 on the 13th to the low of 6235.15 of the 19th, shows that the index has only edged up to 38.2% line, which is not so fantastic. For the market to make a head way to an uptrend then we must see the said recent high broken out. Then should move higher to test the next resistant levels. At this moment in time it is unimaginable. Hence many players will use an uptrend to sell into. Therefore it is not advisable to take positions at present. Instead you should use to exit if your view is short term. I must very clearly mention that the present time is in favour of Value Investors. They should keep collecting on price weakness as and when it happens. Any pessimism and negative sentiments will be there only till June 2016, from then on things will start turning positive, based on many expectations, in and out of the country. But you can not invest or trade on expected sentiments if they do not benefit the Stock you want to enter into. As such we have to see the trade set up before jumping in to conclusions.

Tuesday, January 19, 2016

ASI's darnage slowed...1000 sma prevailed

600, 700, 800 and 900 sma's got shattered out of sight in single days. Sending a hocking feeling of the same to occur on the 1000 sma as well. But it was not so. The index closed higher than the 6259 points which was the mark of the 1000 sma. This was a relief for those who's loan margins were soaring  high against the rapidly falling portfolio values. It is pre-mature to sum up saying things are falling in to place. We have more negative sentiments to ponder, against any positives.

On the 4th instant, the 1st day of the Year the index had a high of 6912 points, since then it came to a low of 6235 points, a drop of 677 points in just 11 market days.

Break down from the 1000 sma, was never seen since 2009, and as such it will be a wish of the bulls to see it holding ground at present. If that was to be expected then the index must rally to test 6900 again. We also can see that the RSI had fallen to 12.54 points. This too is a record, as it is the lowest since 2008.

However if we fail to hold above 1000 sma, the chance of it coming down to test the 20% level of 6136 is a foregone conclusion. Only time we can expect a trend change will be to see higher lows than today's low.

Monday, January 18, 2016

Are we fast pacing down to a BEAR MARKET?

As I mentioned in my last post, the index is falling down as if every thing is pre - orchestrated. Honestly I must say that I do not believe that the market is going to nose dive to bear market territory so fast. Markets would not fall in single lines, as much as they do not go up that way. As such a rally must take place. But that rally will be used by some to sell into, as the present gloominess will not do any good for the bulls to plunder. Unless we see a game change we will be heading to that unfriendly territory of 20% drop since the painful up trend from June 2012. If that is going to happen I hope that it will not be for too long. The best of all is that the friends of the Bears are gathering up their momentum. They are the Long Term value pickers. For them the lower the merrier. They like to see the colour of blood all over as long as they would want. That colour is RED.

Watch out for the following:
1000 sma is at 6259 points.
20% fall from the high of 7670.98 is 6136.78.
Present strategy - Value pickers - Average Down. Traders - stay away. Mature Traders - Make use of the over sold situation to your advantage.

Saturday, January 16, 2016

ASI is down more than 15% from the January 2015 high

6520.33 points on the All Share Index was the 15% low from the high of 7670.98 points on the 12th January 2015. This was shattered out of sight  on the 14th, where another 109.97 points dropped on 1 single day. This worrisome development is bringing more panic to the bulls. Until any sign of a continuous momentum change is visible the market will be in the hands of the bears. We are now lower than the 800 day moving average. The 900 day moving average is at 6326 points and the 1000 day moving average is at 6259 points. We have never seen the 1000 day moving average tested since 2009, that was 7 years ago. The way the market is breaking records it will be sad to see if it falls to this level. The most sad and unfortunate state of affairs is that all the doom and gloom that's happening in the global financial and commodity markets is that all the negative targets are being hit as if the entire drama was pre - orchestrated. The question is that are these so called domino effects relevant to Sri Lanka or not. Market says yes for the time being. As we have plunged below 15% from the 7670.98 high we are now moving in to the BEAR MARKET territory of over 20% that is at 6136.78 points, which is lower than the 1000 day moving average. As this is the 1st time we have come down below 15% from the time the index started rising from the low of 4725 points in June 2012, let's see how things unfold.

Wednesday, January 13, 2016

LLUB - Long term buy @ 315.00 and below

Chevron Lubricants Plc had an unstoppable rally for many years. This is mainly due to their dividend yield. Which in turn had brought a lot of  long term investors into it over the years. Presently it is at crossroads for global investors who had been holding on to it for years. The reason is that the interest rates profile in the global markets are changing. Also the latest attention to fixed income investments from equity investments have seen a change. Thus a bout of selling was evident in the counter ever since it hit an all time high of 460.00 in the early 2015. However the company's dividend record has been consistent, and is evident that it will not change. Coupled with consistent earnings growth, this counter is no doubt is one the best available for any local investor.

Along side the market's fall LLUB too had the bears in control, despite their expected earnings, and dividend growth. Ideally the stock would have taken support at 320.00, which was an important break out point in the past. But it was proved otherwise, as the bears brought it down to 313.00 yesterday.  This downfall has made the RSI to fall to an all time low of 8.4 by the end of yesterday's trading. The prices appear to be very attractive given the present lower oil prices and the ability for them to show improved profits, leading them to maintain an improved dividend pay out. Adding this to your portfolio, at this juncture will be one of the ideal propositions.

Bulls held ground as expected, but there is a long way to go

Yes the market turned around making the bulls stronger. But this is not the only time this has happened during the recent past. Also when the market had come down so much, a small breather is not the best we could expect. As such I earnestly hope that this could last for a few days, and hopefully for weeks. But lets take the days as they come, without being highly ambitious.  For the value investor there are opportunities. I know this because I notice that many careful long term investors have very very slowly started going long today. This crowd would love to see the bears in control, but the short term traders will be the bulls if the trend is going to become a rally for a few days. The question is the magnitude of buying power they would want to put in to the market. Which is a big question. Therefore caution is the best friend for any one who would expect the market to rally. If a rally were to start, then 1st the 6903 points will be the mark to break, as the 10% fall from the 7670 points high is at that. For this to happen the market should go up by 5% or 347 points. Well we have to wait and see for that, after all it took only 7 days to bring the market down by 380 points, and how long do you think will it take to move it up by 340 points. I personally do not want to guess, as my guesses have not realized thus far since.............

Tuesday, January 12, 2016

Market can turn up tomorrow if some conditions are met

7 days tumble made 384.72 points crumble, leaving all and sundry in a jumble which only a selected few could mumble. Ironically on the 12th of January 2015, exactly 1 year ago, the market started to fall till the 31st of March, during this period the index fell 910 points, an 11.86% drop. 2nd fall started 2 days after the General Elections, on the 19th of August 2015, since then to date the market has come down a precipice by 1003.89 points, or 13.33%. RSI too is 2 points away from the 52 week low of 15.05, which was on the 30.03.2015. At present the RSI is at 17.32. Based on this scenario I believe the market to close above today's close, on the morrow. Let me repeat- Tomorrow's close to be higher than Today's. That doesn't mean...... that all is well.

Monday, January 11, 2016

Correction is a fall of 10% or more. Can last for 2 months. Bear is 20% or more.

Market was a field day for the Bears, as it was hammered down more than 60 points. Day by day we see more bears joining the party. It is very painful to see how the values are falling. Given the rampage of information streaming through the print and electronic media, and the VIP's in the authoritative places, it is no surprise that the Market is falling. At this pace I won't be surprised to see the index is testing the 700 day moving average at 6596.40, or 6600 which is a psychological level. Failure there can obviously expose 6500 points, which may not be impossible at this rate. Fundamentally we do not see any light just yet. But we are in Sri Lanka, a country that has no war, no turmoil, no chaos. If we can't make this Country flourish, then it will not be the problem of the Land, but the Man. Fear has kept all away due to the lack of beneficial information for the bulls, till then the risk of negativity will take it's toll on the overall market. Just as much as the Price and volume makes the bears to hold the roost, so will the bulls. But presently it is the Bears on play.

However Markets Go through Bull markets, Bear markets and Corrections. Any time the index trends up and falls 10% or more upto 2 months it is called a Correction before the market move back to the up trend channel. Same will be the case when the market is trending down and goes up 10% more within 2 months. My analysis says that the market is going through a correction. This is the 2nd time it has happened during the last 52 weeks.  The 1st time the market fell 10% or more was on the 27th March 2015, but in 2 market days the trend reversed and moved up. The 2nd time it went down 10% or more was on the 1st of December 2015, and the index is moved down for the 25th market day, at the end of today's trading as well. The next thing is that the market has fallen 261.79 continually for the last 6 days. The bulls may have a sigh any time soon, but till fundamentals are not in favour the turmoil will be frustrating.
 

Saturday, January 9, 2016

HITANG INDALA AVURUDDAK GIYA - One year went by while we were standing


There is a lot of news that is flowing about Economic Turmoils, Regional conflicts, Commodity Price fluctuations, Terrorism, Market Crashes etc when it comes to the World and Sri Lanka. Then inside the Country we have a lack of action in promises, plans and business activity leading to low confidence levels in the public, households and mostly in business activity. As such we get the feeling that the Economy is on an almost FREEZE. Dollar is Rising, Interest Rates are Rising, No New Dollars are coming in a satisfactory way, but Dollars in our Reserves are slowly but surely coming down, DWINDLING. This chaos is leading people to be scared of the GONI BILLA the IMF's probable entry to the Country which has given shivers to the Biggest Business tycoon to the lowest Man who knows how to read the News and understand. This has lead to in action or almost Horror like FEAR on new investments, or New Business to come in thus far in 2016, and in the last 13 months. HITANG INDALA AVURUDDAK GIHILLA is what some one told me in Sinhalese, meaning that 1 whole year has passed while we were Standing. Even though it was told in a lighter vein, it means that we have waisted 1 whole year of our  age without doing nothing. 
SAD and SERIOUS. 

BUT if you want to plan your investments and trades on Technicals, you must be humble enough to respect the TRADING PLAN. I know it is hard to filter through so much of confusion and turmoil. That is why we must understand that the PRICE and VOLUME filters all these.  IT IS THE TRUTH no one can argue about it and win. PRICE AND VOLUME AWAYS WIN. There is nothing wrong in reading and understanding what's going around in the World. Which is so much easier now, thanks to the World Wide Web, but lets trade with HUMILITY and PATIENCE, strictly sticking to the rules and setups.


Friday, January 8, 2016

ASI - DISASTER

The Start of 2016 was not the best since 2006. In fact the market began to usher in the new year with a positive note when it moved up 18 to 20 points on the early hours of 4th, the 1st day of trading for the year. But it wasn't for long. Ultimately we saw 197 points drop for the 1st five days of the week. Market after failing to stay above the 100 day moving average in the early 2015, kept on tumbling down the 200, 300, 400 day moving averages. During the latter part of 2015 the market tried to take support at 500 day moving average , giving a sigh of relief for the bulls. But the expectations were all shattered as the index plummeted down 500 sma within minutes of trading on the 4th. Today's close at 6726.28 means that the trend may drag the market down below 6700 points, too soon. This incidentally will be another critical level of support as the 600 day moving average sits at this level. If we fail to take support at that then the 700 day moving average is at 6600, whilst the 800 day moving average is at 6480 points. If the bears want to hammer it down further then the 1000 day moving average is around 6257 points. The last time the index has fallen below 1000 day moving average was in 2008 - 2009 period.

However I still want to maintain that the Market is on a correction, and  hope we will not see it below 6500 points. A failure to hold that, means we may be moving to a BEAR MARKET territory.  I also believe that the market is at a pivotal period, where once the bears are gone the bulls will certainly take the market to a new level.

Thursday, January 7, 2016

ASI may recover before heading to 6700 points

All Share Index was too fragile to sustain above 6800 points. As such had to give in to the Bears. Thus breaking it below 6800 to close at 6775.27 today.  There may be a slight relief tomorrow, OR the present downtrend could continue further. Therefore tomorrows performance will be critical to watch. Unfortunately
the pessimism is so severe which can be prevalent during the day. Any sentiment change relevant to our traders can change the tide to the positive, despite the pessimism that's around the World. There are many sectors in the Economy who can benefit from the present environment, but the prices suffer due to the sad set of affairs. A true bear market will come only if the index falls below 6500 points. Till then it will be a Correction, but a painful one.


Wednesday, January 6, 2016

TJL Re - Tested 36.30, but NOT BULLISH

My 1st post on TJL was on the 13th of December 2015. At the time I expected the stock to re-test the high of 36.30, and if done it was a gain of 5%, from the lowest low of the 2nd of Dec '15 which was 33.80. As such it was on my watch list. Yesterday the 5th of January 2016, it hit a high of 36.30, but failed to close above with strong volumes. This is not bullish for the time being, unless it goes up and closes above 36.30 with strong volumes. Presently it is trading below the psychological resistant point of 36.00. Until and unless the stock moves beyond 36.00 and closes, I do not expect it to move into higher highs in the short term. Hence I will take it out of the watch list until an uptrend is visible.

Loss and Gain of the ASI in 2021 vs the Loss in 2022

  This ASI chart shows the All time high in 2021 of 9025.82 on the 29th 0f Jan'21 and the fall to the yearly low of 6852.64 on the 19th ...