Thursday, August 13, 2020

Update 8 - COMB - Buy when others Fear.....RCA Strategy has paid off!!!

 RCA STRATEGY 

In December of last year I truly believed that the year ahead is going to benefit the Equity Markets. However due to the challenges that Investors would encounter I initiated a strategy of Accumulation, instead of a Buy and Hold Strategy. Also I wanted to employ a planned out method. Hence I used a fixed volume strategy and a set rupee amount strategy called RCA Strategy. We encountered some of the most extraordinary events that we never expected to happen. Despite the challenges the 2 strategies proved beyond doubt that planned investment approach is rewarding.

The present status of the 2 strategies are given below:

Fixed Volume Amount -

Fixed Volume = 5000 shares at a time

No of Shares Accumulated:            390,000

Scrip dividend:                                   6,901

Total Shares:                                    396,901

Amount Invested:                       31,121,196.80

Dividends received:                         345,000.00

Nett Invested Amount:               30,776,199.80

Cost Per Share:                                         77.54

Closing Price as at 12.08.2020:                81.00

Nett Sale Price:                                         80.09

Nett Sale Value:                          31,788,879.58

Nett Gain/(Loss):                          1,012,682.35

% Gain/(Loss)                                            3.29


Set Rupee Amount or RCA Strategy -

Fixed Rupee Amount = Rs. 500,000.00 at a time

No. of Shares Accumulated:                 515,583

Scrip Dividend:                                         9,110

Total Shares:                                          524,693

Amount Invested:                        39,500.000.00

Dividends Received:                        378,820.10

Nett Amount Invested:                39,121,179.90

Cost Per Share:                                          74.56

Closing Price as at 12.08.2020:                81.00

Nett Sale Price:                                         80.09

Nett Sale Value:                           42,022,628.12 

Nett Gain/(Loss):                           2,901,448.23

% Gain/(Loss)                                             7.42


The next stage of accumulation will only be if the prices fall below the 2 average prices.

Targets Placed are - 

 Ave Price + 50% or PE of 9.8  (EPS as at 31.12.2019 was 16.80, which can be lower in 2020).


Friday, June 19, 2020

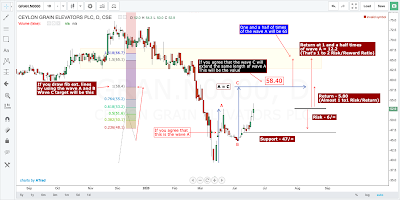
GRAN Price Action - What happens if Wave C is gonna match Wave A?

ASI and many Counters have witnessed 3 Wave structures mostly when there had been steep falls. This formation can be witnessed in GRAN as well. Present support is 47, resistance was 53, which was re-tested today. In fact we saw the prices trying to close above 53, but failed for the day. If a breakout is to happen then the wave A length could be seen in the wave C and that equation is at 58.40. You can see that in two ways of measurements drawn in the chart. If some one wants to enter at 53 to target 58.4, the risk to reward ratio would be 1to1 given the support at 47. If we see a strong movement in prices the Wave C could test one and a half times of the wave A. That too has happened in the past. All this wont happen in isolation without macro and micro fundamental effects. Hence entering to a trade needs a lot of thinking, and a strict stop loss at 47.

Thursday, June 18, 2020

Commercial Bank - Price Action


Amidst haemorrhage in this counter there was a reversal to the up. But that doesn't mean every thing is well. However it's worth a following. If the uptrend which we see now to continue, the price has to break above 71.90 and resume the trend. Also with above average volumes. IF the price is trending within a range, then the low of 60.50 and a high of 71.90 will turn out to be a painful consolidation. If we see the prices breaking out we can expect it to test 77 to 85 range.  20 EMA at present is 66.90. That is also an area which could act as a support.

Tuesday, June 16, 2020

AEL - M-REV, how is it now


It was on the 8th we saw that all conditions were met to initiate a Buy based on the M-REV Strategy on AEL. 6 market days thereafter, as of today the 16th of June we can see the prices are consolidating within a bullish flag formation. We need to see the prices moving above the upper trend line of the Flag-Channel, to expect the prices to test 19/50 or even 20/=. A Sell will be initiated only when the conditions are met to Sell. In this Strategy we do not plan for a stop price as the Take Profit and Stop Price both will be made based on the said Sell Conditions. In terms of Price action the present support is at 16/=, and another strong support is at 15/=. Whoever wants to take a trade other than this strategy can place stop loss levels at those prices.


Friday, May 22, 2020

AEL - M-REV Strategy as at 22.05.2020 MACD crossed above zero line. Wait for other signals!!!


ASI,COMB and JKH Daily and 15 mts Charts as at 22.05.2020

ASI as at 22.05.2020


COMB as at 22.05.2020


JKH as at 22.05.2020


Update 7 - Commercial Bank - Buy When Others Fear........Take a look at Set Rupee Amount Investing "RCA STRATEGY"

   RCA STRATEGY   

The challenge of covering updates of this Strategy of Stock Accumulation was daunting. But when you stick to the Rules and Conditions it is not that tough. 

Stock Accumulation can be done in many ways. Two Practical methods are - Buying a Fixed amount of Shares, OR Investing a Set Rupee Amount at Fixed Intervals.

Today I am sharing the Stock Accumulating Strategy of Investing a Set Rupee Amount at Fixed Intervals. This is a favourite Strategy Mr. Benjamin Graham had followed. This is what Mr. Warren Buffet had been telling Investors to Practice. This is one of the Simplest Ways to build a Decent Portfolio. This is one of the best Strategies that you must get to know to Practice. This is called Dollar Cost Averaging or Constant Cost Averaging, and in the UK this is called Pound Cost Averaging. We in Sri Lanka can call it Rupee Cost Averaging. I call it the RCA STRATEGY. 

Are You a Young Executive? Or an aspiring Manager, Perhaps an Entrepreneur who wants to Build Up a Portfolio from a Part of Your Investing funds. You might be a Young Lad who would want to Improve the Habit of Investing and Trading. 

We are going through a period that many of us have never encountered. This is the era the world became a NEW NORMAL WORLD. Yes the changes we are doing to us individually and collectively, is shaping the Present and the Future. 

Colombo Stock Exchange is the Same. We lagged so many infrastructure developments, thanks to Covid-19 has made the Brains behind the Market to act now. That change is Rapid for sure. Not only that... what about the Listed Companies in the Market? They too have embraced these changes and we will know how they are shaping themselves and their Stakeholders. This is a Global phenomena, as such the magnitude of the change can not be quantified immediately. As such the Price action in the Market will swing rapidly too.

RCA STRATEGY is a fantastic one to follow in this backdrop. 

Use it to pick your favourite Companies at your own pace. 

The BASIC IDEA of this is to BUY MORE shares WHEN PRICES are LOW and FEWER SHARES when PRICES are HIGH.

You have to decide on a set Rupee Amount, when you invest. To make things simple you can decide on fixed intervals. 

What you mean by fixed intervals is that you can decide in investing once a Week, Month or Once a Quarter. You can also invest Set amounts per Stock when you are investing whether or not you have fixed an interval. The idea as mentioned earlier is to Buy more at lower prices and Fewer at higher prices, by allocating a fixed rupees amount each time you invest. Is that difficult to do.

This is ideal for those who would want to follow a system and a set of conditions. IF you do not like to follow a system and procedure to invest or trade this will not help you. But if you are that person who likes to be methodical and analytical this strategy will certainly fit you.

Ask Your IA more about it. If not send me a message or comment below. I will be more than happy to chat about it with you.


Strategy - Stock Accumulation
Counter - COMB
Buying Rule: Buy only if the stock is below 100.00
Buy rule 1st amendment : Buying below 91.80 due to 
dividend adjustment
Buy rule 2nd amendment : Will keep accumulating below 
the trailing Average Price
Buy Rule 3rd Amendment : Buying below the current Ave.Price. 
Buying will Stop when the price is higher than the average.
Intervals of Accumulation: 3 times a week. i.e. Mon,Wed and FRI.
Start Date: 06.12.2019
Sell Rule: only if the P/E ratio is 9.8, OR the ROI is above 50%
Trade is still open as at: 22.05.2020 
Cost Per Share based on Fixed Volume - 85.99 (adjusted for dividends)
Cost Per Share based on RCA Strategy = 81.62 (adjusted for Dividends)
Holding Volume - As Per Fixed Volume  = 200,000
Holding Volume - As Per RCA STRATEGY  = 246,923
Amount Invested - As Per Fixed Volume  = 17,197,803.20
Amount Invested - As Per RCA STRATEGY = 20,155,000.00
Dividend income of Rs.345,000/= 
Scrip Dividend is pending
Expected Amount of Shares from the Scrip dividend 4678 as per Fixed Volume
Expected Amount of Shares from the Scrip dividend 5776 as per RCA STRATEGY
period since the start: 166 days as at 22.05.2020
Market days : 71 days
Stock Accumulated Days : 40 Days
Present Target Price 1 - Ave Price + 50% - 133.71
Present Target Price 2 - PE of 9.8 - 164.64
(EPS as at 31.12.2019 is 16.80)


Saturday, May 16, 2020

M-REV Trading Strategy


From the 12th of May 2020 I started covering a Strategy on AEL, which is called M-REV. It is the combination of MACD,RSI and EMA indicators coupled with Volumes of the Stock.
The Strategy has Conditions to meet for Buying and Selling decisions. These conditions have to be met fully to Buy or Sell.

The following chart is what I did on the 12th, here you will see the conditions of the Strategy.


Now the stock along with many Stocks increased in prices. AEL after a low of 10/60 touched 15/50 that's a 50% return in 2 days. It closed the week at 14/50. 

The M-REV Strategy is not one to follow if you need to trade swings that you see in Price volatilities. For that you have many other strategies. Based on this strategy you have to wait until conditions are met to Buy or Sell. But for now we shall wait until the Conditions are met to Buy.

Price action along with Volume as at 15th of May is given in the Chart below:


Tuesday, May 12, 2020

CSE after COVID - Colombo Stock Exchange Opened for Trading After 8 Weeks

Covid-19 and many other issues made the CSE to close trading for nearly 8 weeks, for the First Time since it started in 1985. 

It in fact resumed business yesterday the 11th of May 2020. Market survived only 38 seconds for business on that day as the Prices of Stocks in the S&P SL 20 Index took a hit of 10% at Pre-Open Session, and as it moved into Normal Market Sessions the 10% circuit breaker triggered closing the market then and there. 

Today the 12th of May the 5% circuit breaker for the S&P SL 20 triggered just 9 minutes in to Normal Session of Trading and, the Market was closed for 30 minutes.  Index survived to be over 5% during the rest of the session till the closure of the Market for the Day. Finally the ASI which is the Index covering all the Listed Counters suffered a fall of 3.2%. Despite a Shortened Trading Session of 3 hours instead of the Normal 5 hours in the CSE, the Turnover and the level of Trading was commendable. Turnover for the Day was Rs. 3.6 Billion and the number of Trades were 8050. 

Many of the Major counters dropped considerably, some recovered, some didn't.

As I am more interested to update you regards the price action of the market I have shared here the Daily Chart of the ASI. As you can see in the chart we will see the market trying to test 4000 before a rebound. However as shown by the RSI the market is extremely oversold, which could help the market to re-bound. But with many things are so uncertain due to the Pandemic the said re-bound will not be able to be defended without the backing of Fundamentals.  Since the RSI is so low we might see the index rebounding before testing 4000, which is a possibility. However since there are no indications to that happening we have to see whether the ASI is falling towards 4000 before a reversal.

Whoever would want to adhere to Strategies in Investing and Trading will be rewarded without a doubt. But how many are doing that? How many would know whether they are Investors or Traders in the First Place. If you want to follow Strategies and succeed please do not hesitate to comment.


Friday, May 8, 2020

යාවත්කාලීන කිරීම 6 - කොමර්ෂල් බැංකුව- COMB.N.0000 - අනෙක් අය බිය වන විට මිලදී ගන්න!!! ඔවුන්ගේ තන්හාව වැඩි විටදී විකුනන්න!!!


Add caption
COMB හි මෙම උපායමාර්ගය ආවරණය කල සම්පූර්න කාල වකවානුවේදීම, මිල ක්‍රියාකාරිත්වය පහළට නැඹුරු විය. දැන් අපි අපේ ජීවිතයේ වඩාත්ම සිතාගත නොහැකි කාල පරිච්ඡේදයක් පසුකරමින් සිටිමු. ඔබ 1918 සිට 1920 දක්වා කාලයේ තරුණයෙක් ව සිටියානම් Spanish Flu නමැති උණ පැතිරී ගිය අවධියේදී ඔබ අත්විඳි දේ අපට පැහැදිලි කළ හැකිව තිබුනා. නැතහොත් එය නිසැකවම එක්සත් ජනපද ජනාධිපතිගේ සිට පෘථිවියේ ලාබාලම වීදි පිරිමි ළමයා දක්වා අලුත් දෙයක්බ ව නිසැකයි . මීළඟ මාසය, කාර්තුව, වසර, අවුරුදු 2, අවුරුදු 3 හෝ අවුරුදු 10 තුළ කුමක් සිදුවේදැයි කිසිදු ආයතනයක් නොදන්නා 
තත්වයක වර්තමානයේ එය විශාල අබියෝගයක් බව නොරහසකි.

දිගු කාලීනව දේවල් හොඳ අතට හැරෙනු ඇතැයි අපි සැවොම ප්‍රාර්ථනා කරමු. පෘථිවියේ ධනවත්ම මිනිසාගේ සිට දුප්පත්ම දුප්පතුන් දක්වා ඇති එකම සහතිකය එයයි.

දැන් මිල යනු ඔබ ගෙවන දෙයයි. වටිනාකම යනු ඔබට ලැබෙන දෙයයි. අවස්ථා ලැබෙන්නේ කලාතුරකිනි. රත්තරන් වැසි වැටෙන විට, බාල්දිය එළියට දමන්න, ඇඟිල්ල දිගු නොකරන්න. ආයෝජකයෙකු ලෙස ඔබේ මිතුරා පුළුල් ලෙස බිය වන්නේ, එය කේවල් කිරීමෙන් මිලදී ගැනීම් සඳහා සේවය කරන බැවිනි. අපි මේස් හෝ කොටස් ගැන කතා කළත්, මිල පහත ඇති විට ගුණාත්මක වෙළඳ භාණ්ඩ මිලදී ගන්න. අන් අය කෑදර වූ විට බිය වීමට උත්සාහ කරන්න - අනෙක් අය බිය වන විට පමණක් කෑදර වීමට උත්සාහ කරන්න. අපට සිදු වන හොඳම දෙය නම් විශාල සමාගමක් තාවකාලික කරදරයකට වැටෙන විට, ඔවුන් ශල්‍යකර්ම මේසය මත තබා ඇති විට ඒවා මිලදී ගැනීමට අපට අවශ්‍යය. සාධාරණ සමාගමකට වඩා අපූරු සමාගමක් සාධාරණ මිලකට මිලදී ගැනීම වඩා හොඳය. ආයෝජකයා සඳහා, විශිෂ්ට සමාගමක කොටස් ඉතා ඉහළ මිලක් ගෙවා අයිතිකරගැනීම පසුකාලීන දශකයක වාසිදායක ව්‍යාපාර වර්ධනයන්හි බලපෑම අහෝසි කළ හැකිය. ආයෝජනයේ ප්‍රධාන දෙය නම් කර්මාන්තයක් සමාජයට කොතරම් බලපෑමක් ඇති කරයිද යන්න හෝ කොපමණ ප්‍රමාණයක් තක්සේරු කිරීමද නොවේ. එය වර්ධනය වනු ඇත, නමුත් ඕනෑම සමාගමක තරඟකාරී වාසිය තීරණය කිරීම සහ සියල්ලටම වඩා එම වාසියෙහි කල්පැවැත්ම තීරණය කරයි. කාන්තාවන් නව දෙනෙකු ගැබ් ගැනීමෙන් ඔබට මාසයක් තුළ දරුවෙකු බිහි කළ නොහැක. ඔබ වසර දහයක් සඳහා කොටසක් අයිති කර ගැනීමට අකමැති නම්, එය විනාඩි දහයක් සඳහා අයිති කර ගැනීම ගැන සිතන්නවත් එපා. කැපී පෙනෙන කළමණාකරණ සහිත කැපී පෙනෙන ව්‍යාපාරවල කොටස් අප සතුව ඇති විට, අපගේ ප්‍රියතම රඳවා ගැනීමේ කාලය සදාකාලිකය. වෙළඳපල චලනයන් විශ්වසනීයව පුරෝකථනය කළ හැකි ක්‍රමයක් මා නොදන්නා බැවින්, හොඳ සමාගම් කොටස් මිලදී ගැනීමට මම නිර්දේශ කරන්නේ ඔබ අවම වශයෙන් අවුරුදු පහක් වත් ඒවා තබා ගැනීමට අපේක්ෂා කරන්නේ නම් පමණි. කෙටිකාලීන ලාභ අපේක්ෂා කරන අය වෙනත් තැනක බැලිය යුතුය. ආයෝජනය‍ යනු හොඳ වෙලාවට හොඳ සමාගම් තෝරා ගැනීම් සිදුකිරීම සහ ඒවා හොඳ සමාගම් ලෙස පවතින තාක් කල් ඔවුන් සමඟ සිටීමයි.

ආයෝජකයෙකුගේ වැදගත්ම ගුණාංගය වන්නේ බුද්ධිය නොව ස්වභාවයයි. ඔබට අවශ්‍ය වන්නේ සමූහයා සමඟ හෝ සමූහයාට විරුද්ධව සිටීමෙන් මහත් සතුටක් නොලැබෙන ස්වභාවයකි. මම ඔබට කියන එක් දෙයක් නම් ඔබට කළ හැකි නරකම ආයෝජනය මුදල් ය. හැමෝම කතා කරන්නේ මුදල් රජ වීම ගැන සහ ඒ වගේ දේවල් ගැනය. කාලයත් සමඟ මුදල් වල අඩු වනු ඇත. නමුත් හොඳ ව්‍යාපාර කාලයත් සමඟ වටිනාකමක් බවට පත්වේ.

මා මෙහි ආවරණය කරන ක්‍රමෝපායේ පදනම, ඉහත සඳහන් උපුටා දැක්වීම් වලින් ආනුභාව ලත් ක්‍රමෝපායකි. මේවා වටිනා කියමන් යැයි අප කියන්නේ නම්, යම් අවස්ථාවක දී ඒවා භාවිතා කළ යුතු අතර,එම කාලය දැන් පැමින ඇත.

පහත දැක්වෙන්නේ COMB උපායමාර්ගය හා වර්තමාන තත්ත්වය පිළිබඳ විස්තර ය. වර්තමාන වෙනස්වීම් සමඟ නොනවත්වා තබා ගැනීමේ උපාය මම යාවත්කාලීන කර ඇති අතර ඒවා දම් පාටින් ඉස්මතු කර ඇත:

උපායමාර්ගය Strategy - කොටස් සමුච්චනය Stock Accumulation
කවුන්ටරය - COMB
මිලදී ගැනීමේ රීතිය: තොගය 100.00 ට අඩු නම් පමණක් මිලදී ගන්න
මිලදී ගැනීම සන්දහා 1 වන සංශෝධනය : ලාභාංශ ගැලපුම හේතුකොටගෙන 91.80 ට අඩු අගයකට මිලට ගැනීම
මිලදී ගැනීම රීතිය 2 වන සංශෝධනය:  වර්තමාන  සාමාන්‍යය අගය වන 89.14 පහත කොටස් රැස් කරගැනීම
ක්රොට්ස් කරගන්නා කාල පරතරයන්: සතියකට 3 වතාවක්. එනම් සදුදා, බදාදා සහ සිකුරාදා.
ආරම්භක දිනය: 06.12.2019
විකිනීමේ රීතිය : P / E අනුපාතය 9.8 ක් නම් හෝ ROI 50% ට වඩා වැඩි නම් පමණි

මෙම කොටස් එකතු කිරීම තවමත් විවෘතව ඇති දිනය: 20.03.2020
කොටසක පිරිවැය - 89.14 (ලාභාංශ සඳහා සකස් කර ඇත)
RCA මත පදනම්ව කොටසකට පිරිවැය - 86.54
දරණ පරිමාව - 180,000
ආයෝජනය කළ මුදල - 16,390,035.20
ලාභාංශ ආදායම රු .345,000 / =
ස්ක්‍රිප්ට් ලාභාංශ අපේක්ෂිතය
ආරම්භයේ සිට කාලය: 2020.03.20 දිනට දින 105 ක්
වෙළඳපොළ දින: දින 63 යි
වර්තමාන ඉලක්ක මිල 1 - සාමාන්‍ය මිල + 50% - 133.71
වර්තමාන ඉලක්ක මිල 2 - PE 9.8 - 164.64
(2019.12.31 දිනට EPS 16.80 වේ)

පහත වගුව:


Monday, May 4, 2020

Update 6 - Commercial Bank Plc - Buy when others fear, and blood is on the street

Right along the coverage of this Strategy on COMB, the price action was tilted downwards. Now we are going through the most unimaginable period of Our lives. If you were a young chap during 1918 to 1920 you might be able to explain to us what you experienced during the Spanish Flu. Else it is certainly something new from the President of the United States to the youngest street boy in the planet. Times are challenging to the point that no body knows what will happen in the next Month, Quarter, Year, 2 Years, 3 Years or 10 Years from now. We all humans would want to wish that in the long run things will be certainly better. That's the only certainty from the Richest Man on Earth to the Poorest of the Poor would say with super confidence.

Now Price is what you pay. Value is what you get. Opportunities come infrequently. When it rains gold, put out the bucket, not the thimble.Widespread fear is your friend as an investor because it serves up bargain purchases.Whether we're talking about socks or stocks, buy quality merchandise when it is marked down.We simply attempt to be fearful when others are greedy and to be greedy only when others are fearful.The best thing that happens to us is when a great company gets into temporary trouble, We want to buy them when they're on the operating table. It's far better to buy a wonderful company at a fair price than a fair company at a wonderful price. For the investor, a too-high purchase price for the stock of an excellent company can undo the effects of a subsequent decade of favorable business developments.The key to investing is not assessing how much an industry is going to affect society, or how much it will grow, but rather determining the competitive advantage of any given company and, above all, the durability of that advantage.You can't produce a baby in one month by getting nine women pregnant. If you aren't willing to own a stock for ten years, don't even think about owning it for ten minutes.When we own portions of outstanding businesses with outstanding managements, our favorite holding period is forever. Since I know of no way to reliably predict market movements, I recommend that you purchase Good Company shares only if you expect to hold them for at least five years. Those who seek short-term profits should look elsewhere. All there is to investing is picking good stocks at good times and staying with them as long as they remain good companies.

The most important quality for an investor is temperament, not intellect. You need a temperament that neither derives great pleasure from being with the crowd or against the crowd. The one thing I will tell you is the worst investment you can have is cash. Everybody is talking about cash being king and all that sort of thing. Cash is going to become worth less over time. But good businesses are going to become worth more over time. 

The basis of the Strategy I am covering here are inspired by the above quotes by a famous investor who needs no introduction. If we say these are valuable sayings, then we need to use them at some point, and that is now. 

The following are the details pertaining to the COMB Strategy and the present status. I have updated the strategy to keep abreast with the current changes and they are highlighted in Purple:

Strategy - Stock Accumulation
Counter - COMB
Buying Rule: Buy only if the stock is below 100.00
Buy rule 1st amendment : Buying below 91.80 due to 
dividend adjustment
Buy rule 2nd amendment : Will keep accumulating below 
the trailing Average Price - Present Trailing Average is 89.14
Intervals of Accumulation: 3 times a week. i.e. Mon,Wed and FRI.
Start Date: 06.12.2019
Sell Rule: only if the P/E ratio is 9.8, OR the ROI is above 50%

Trade is still open as at: 20.03.2020
Cost Per Share - 89.14 (adjusted for dividends)
Cost Per Share Based on RCA - 86.54
Holding Volume - 180,000
Amount Invested - 16,390,035.20
Dividend income of Rs.345,000/= 
Scrip Dividend is pending
Period since the start: 105 days as at 20.03.2020
Market days : 63 days
Present Target Price 1 - Ave Price + 50% - 133.71
Present Target Price 2 - PE of 9.8 - 164.64
(EPS as at 31.12.2019 is 16.80)

Below is the Chart:


Friday, February 28, 2020

ASI has moved in to correction territory


As the World Markets are taking a hit and the media is reporting that many markets are in a correction. The ASI dropped below 10% as well. According to the definition of a correction the value of a stock or an Index falls bellow 10%. Now that it has happened in our market let's see how long this correction is going to be there.


Update 5 - Commercial Bank Plc - Buy when others fear, and blood is on the street

Since my last update on the 10th of January '20, Strategy I am following on Commercial Bank Plc is still open. Its customary dividend payment was announced on the 31st of Jan, and went XD on the 12th instant. At which point we held a volume of 115,000 shares. Dividend was Rs.3/=. One good thing that happened to this dividend is that it was free from Withholding Tax, as such received a payment of Rs. 345,000/=. With this the Dividend Adjusted Average Cost is now at Rs.91.41, with 150,000 shares in hand and the Investment is Rs.13,711,691.20. On the 20th of this month they announced the final dividend of Rs.2/= by way of shares, and the XD date is yet to be announced. I have done an amendment to the Buy Rule due to the Dividend Adjustment and the Stock accumulation will take place at or below 91.80 which was the Dividend Adjusted Average Price on the XD date.

As far as as Fundamentals of the Bank are concerned, the prices that it is trading at are real bargains, but only those brave hearts would want to accumulate even at lesser intervals than what is covered in this Strategy.

My intention of covering this counter based on this strategy was all to prove that it is NOT EASY to make money in the Stock Market but NOT HARD, provided you follow a strategy with Confidence. If we doubt and not certain that this stock will give us the desired returns, then you can not continue with a strategy at all. As far as I am concerned the credentials of this Bank is stupendous for the Prices that its trading at, right now. Therefore I will keep up to this strategy till I achieve the desired returns.


Friday, January 24, 2020

ASI - Do not loose this opportunity!!!


If you happened to read my last short note on the ASI, you would remember that I mentioned that there is a chance of the ASI recovering. The RSI had to move above 50 points and, the index line had to move above 9EMA. Both of these were seen happening. The aggression in the hourly RSI is still too much. Hence we may see the Index wanting to test the Resistance area between 6001 and 6027 with the RSI testing the overbought area above 70 points. This may happen during the early part of the week. However as we are nearing the month end the index may be at the mercy of  bears. As such it will be interesting to see how the Bulls are going to over power the bears throughout the week. December Earnings are trickling in and the message that the results are going to give will certainly help the market momentum in the short term, whilst the medium to long term trend is filled with positive sentiments due to the bold measures the GOSL has initiated. As such the short term market is very important for those who want to collect. Do not loose this opportunity.


Sunday, January 19, 2020

ASI - Next week is critical. Watch for the RSI and the EMA 9 on the Hourly chart

The short term trend is bearish in the ASI. The RSI on the weekly chart broke below 50 since Sept'19. There is a chance for the ASI to recover in the next week for which the RSI has to break above 50 points and the index line should rise above the EMA 9 on the hourly chart. Lets hope that will happen during the week.


Sunday, January 12, 2020

ASI took a hit. now what?

It was not something we Sri lankans expected that happened on the 8th of Jan'20. Index  came down by 2.16% which wasn't seen even in the Iranian Market who were directly effected. Iran was down 1.4%. Index closed the week on a positive note, but the momentum is still not strong. It will try to pierce through 6000 points in the week to come, but how it will sustain is something to be watched. RSI which was bearish during the previous week retraced further this week. That needs to rise over 50 points. One important factor for a continued upward momentum will be positive fundamentals in the December Quarter which will start to trickle in from the 3rd week of this month. Till then the Market will fluctuate on sentiments.

ASI hourly chart on the 3rd of Jan'20


ASI hourly chart on the 9th of Jan'20


Thursday, January 9, 2020

Update 4 - Commercial Bank Plc - Buy when others fear, and when blood is on the street

Price action in Commercial Bank is still bleeding. We have completed 35 days and 22 Market days in this strategy of Stock Accumulation. We have accumulated 60,000 shares at an average of 97.27 in the process. The sudden pessimism in the overall market due to the quietness seen as we are passing through the new year has brought a lot of uneasiness into the market. This pessimism is good for those who would want to keep accumulating any stock that they are following. But certainly not ideal for those who would want short term volatility. Therefore this negative period in the overall sentiment of the market is ideal for the strategy we are covering in this post. The market noise surrounding this counter is all bearish, hence this strategy is not for noise traders. If you are one of them do not read this article. The present low for the counter is 92.00 on the 8th of Jan'20. That was the day after Iran sent missiles to US Bases in Iraq. Markets world over fell but the Colombo Stock Market was one of the worst performers with a fall of 2.4%, whilst the US futures and all the Middle Eastern Markets  including Iran closed above that. COMB compared to the ASI didn't fall that much, but took a hit. The quietness prevailing in the market was the biggest cause for the Panic Button. Chart given below explains the story further.


If you are interested to read the previous post you can access it here....

Sunday, January 5, 2020

ASI - Present Status as at 03.01.2020


Before giving my write up for the present status, I'd like to post the images with regards to the  hourly chart which I started following since 15th of December 2019.

My 1st Image

Date : 15.12.2019
Narration : ASI was successfully defended at 6050. But the strength of the Bulls are at check!!!
Image:

2nd Image

Date: 18.12.2019
Narration: RSI on the ASI shows a Bullish Divergence on the Hourly Chart.
Image:

3rd Image


Date: 20.12.2019
Narration: ASI - Hourly Chart has a bullish formation, but how many naysayers are out there due to the SME Moratorium
Image:


4th Image

Date: 27.12.2019
Narration: ASI successfully defended 6050. Rose above 6100!!!
Image:


Now to the present status

You can see in the 4th image a zone coloured in Pink. That is the resistance zone that was expected to be cleared and form as a base for the trend extension to test higher highs further on. That zone is between 6122 and 6185, but 6100 is the support that is needed to be defended at present. That area of resistance was tested within a matter of 4 market days during the week that we ended. Weekly high was 6175.76 and trended down to test 6100 points. ASI closed the week at 6111.28. The aggression on the RSI had to cool off. That's exactly what happened during the week. It propelled to hit a high of 87 points (which is the previous high, as you can see in the chart), had to see bears taking control of the momentum HENCE. Bears were successful in bringing the RSI down below 50 points to close at 47 points. The momentum is key at present. We can see that the top counters in the market are consolidating after testing the recent highs. The activity is confined to a few counters with stories than any substance. This has made traders to gather in numbers to trade a few counters. If these traders aren't used to money management, they will certainly experience what they do not want to experience. Trading with lot sizes that can be easily stopped is a must in the present trend than ever before. Policy Makers and Market Participants have high hopes for the Economy and the Market in 2020. That's a chance (Risk) you need to take in the market. After all if you don't take risks no need to get into the Stock Market. You will succeed only if you have knowledge, experience and confidence to manage that Risk. Else PLEASE stay away and park your precious cash in lower risk assets.

Present image is given below:


For those who are interested in having a look at the Daily, Weekly and Monthly Charts, I give them below:

Daily Chart as at 03.01.2020


Weekly Chart as at 03.01.2020


Monthly Chart as at 03.01.2020


Friday, January 3, 2020

LFIN - An Update!!!

11th of August we analysed LFIN based on Price Action as against the Dividend Payments and Splits in terms of holding it for Long Term.

At the bottom of the post the following was stated

- Quote -

Also if you closely look at the chart given here you will notice that it is trading within a channel where the present resistance line in green is at around 136/80. This area needs to be broken out, to test the area highlighted in yellow. From there onwards we will see new highs. But as the history of this stock has shown, the major price action has happened during the time of a split. Since they have not made a decision to split for 4 years, we may be nearing the year of decision making for the split. But that decision will happen only at the right time based on the thinking of the Board of Directors.

- Unquote -

In that post I shared the following daily chart :


(You can go to that post here.....)

From the latter part of Oct 2019 we saw the prices breaking out of that resistance of 136/80, and by the 18th of November 2019, prices have entered into the Yellow zone. The bottom of the zone is 150/50, and since the entering into the zone we can see that the prices are more or less taking support at or around 150/=. We saw the price closing above the present high of 159/80 to close at 160/= with volumes. It was an encouraging close as the volumes at 160/=, were the highest for the day. However this counter had always gone up to above average prices with Splits. Whilst they have not done a stock split for more than 4 years, the level of expansion of the business may need capital infusion. Therefore Splits, Rights issues, good earnings and dividends may have a bearing on further price movements on this counter. Any of these developments will be well taken by the long term shareholders. But remember that though these developments are possible, we can in no way speculate on assumptions, therefore whoever that is reading this post must know what they are doing. You must know whether you are a Trader or an Investor. Thereafter you need to follow your strategies with strict money management techniques, where rules for risk and reward are clearly defined. If you cant understand that, the best is to increase your knowledge on strategies before putting in your hard earned money in to the Stock Market. After all making money in the Stock Market is not easy, but not hard only with increased knowledge and understanding.

The present chart is given below:


Loss and Gain of the ASI in 2021 vs the Loss in 2022

  This ASI chart shows the All time high in 2021 of 9025.82 on the 29th 0f Jan'21 and the fall to the yearly low of 6852.64 on the 19th ...