Making money in the Stock Market is not easy, but not hard only with increased education and understanding.......
Friday, June 19, 2020
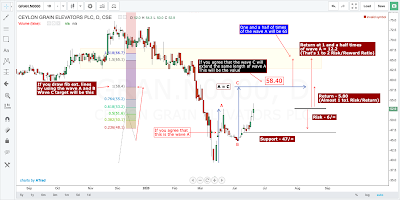
GRAN Price Action - What happens if Wave C is gonna match Wave A?
ASI and many Counters have witnessed 3 Wave structures mostly when there had been steep falls. This formation can be witnessed in GRAN as well. Present support is 47, resistance was 53, which was re-tested today. In fact we saw the prices trying to close above 53, but failed for the day. If a breakout is to happen then the wave A length could be seen in the wave C and that equation is at 58.40. You can see that in two ways of measurements drawn in the chart. If some one wants to enter at 53 to target 58.4, the risk to reward ratio would be 1to1 given the support at 47. If we see a strong movement in prices the Wave C could test one and a half times of the wave A. That too has happened in the past. All this wont happen in isolation without macro and micro fundamental effects. Hence entering to a trade needs a lot of thinking, and a strict stop loss at 47.
Subscribe to:
Post Comments (Atom)
Loss and Gain of the ASI in 2021 vs the Loss in 2022
This ASI chart shows the All time high in 2021 of 9025.82 on the 29th 0f Jan'21 and the fall to the yearly low of 6852.64 on the 19th ...

-
This ASI chart shows the All time high in 2021 of 9025.82 on the 29th 0f Jan'21 and the fall to the yearly low of 6852.64 on the 19th ...
-
Dr. Michael Burry is the ONE EYED Physician turned Fund Manager, who figured out that the Housing Market in the US is going to fall apart,...


No comments:
Post a Comment