Wednesday, January 30, 2019

What happened to KAPI should happen to these Stocks too.......

A lot of those who are scratching their heads wandering what's going on with KAPI please read the following link: http://techwatch-esgee.blogspot.com/2019/01/kapi-what-is-going-on.html.

For those who are wanting to know what would happen to many other counters that had up-trends but pulled back, please go through the following:

MASK Weekly Chart

If you look closely at the chart below, I have highlighted a PIN BAR of which the tip of the upper end is 13/50. Then I have pointed out the upper ends of the tips of the last 2 candles. It shows that the price went up above the said 13/50, but did not close. Therefore the following 3 factors must be fulfilled for the stock to move higher.

1). Volumes must increase.
2). No. of Trades should go up and,
3). Price must breakout of 13/50.

This is exactly what happened to KAPI. The Volumes increased yesterday, and the number of trades also went up. Finally the price just broke out of the resistance forcefully with volumes and trades today.

If this scenario is not going to be seen in MASK, there won't be higher highs.
Lack of Trades and volumes at the present levels suggest that force full selling that can bring the prices down sharply cannot be seen in this counter at present. We also see a double bottom at 12/50, but with lower volumes, which is somewhat positive. As this is the day 3 of the consolidation phase, we need to expect the good and the bad to come forth until the above factors are met, and a break out takes place.


BALA Weekly Chart

In the case of BALA the resistance is at 17/00. As you can see in the chart this 17/00 rupee mark had been a strong make or break (Pivot) point. Just like in MASK the factors mentioned must be met for BALA to move higher.


 ELPL Weekly Chart

22/90 is a major resistance here. Need to Breakout of that to expect new highs. Here again the above mentioned factors will have to be met.


Tuesday, January 29, 2019

SAMP in the Target Zone. Straight line target reach won't happen always

Yesterday we saw the price breaking out of the consolidation zone on SAMP, and today we saw the prices entering into the Target Zone. RSI is at 65 means it is still not oversold. However a straight line hit to the top of the target zone won't happen always. Since we have tested 240/00 today, price will need to close above that with volumes to reach 245/00. But entering the zone is quite significant, within a short period.


MASK, BALA and MADU must breakout for new highs

Plantations took a breather after some heavy trading during the last week. This consolidation is nothing unusual in a trend. Let's see the price action on the above mentioned charts.

MASK Daily Chart

13/50 for this counter had been an important level. The stock is testing that level at present. That must be broken with strong volumes to see the stock moving towards 15/00.


BALA Daily Chart

17/00 is a major resistance point which needs to be broken out with volumes for the counter to move up towards 19/50.


MADU Daily Chart

8/00 is the breakout point of MADU. Failure to do so will stretch the consolidation. Thereafter only it would test 8/80 to 9/00.


If any one is taking trading positions on these counters there are two strategies, a). Wait for the break out or b). Buy within the consolidation. Either way please have your stops as nothing is certain in life.

Monday, January 28, 2019

SAMP - Trade Idea - the progress

19th of Jan 2019 I shared a trade idea on SAMP, to Buy between 225/00 and 230/00, with a Stop at 223/10, and a target between 238/00 - 245/00. You could refer that here : http://techwatch-esgee.blogspot.com/2019/01/samp-new-trend-formed-trade-idea.html

Today the price closed above the resistance of 233/00 with volumes. Higher highs would happen if the price line cut above 238/00 which is the recent high and test the important zone between 240/00 and 245/00. Let's see how it performs.

Sunday, January 27, 2019

ASI weekly report with a difference - 25.01.2019

Week ending 25.01.2019 saw the number of trades moving up to 23,534 against 16,386 of the previous week in the ASI. This is the highest for the Month. The market PE dropped to 9/39 over 9/57, and the PBV edged higher to 1/18 from 1/16. This was an indicator that despite the Trades increasing considerably the value in the Market has dropped. Another noticeable feature is that the Purchases made by Locals had dropped amidst heavy trading (from 2.8Bn to 958Mn). Sales by the Locals had decreased too (from 1.36Bn to 1.2Bn). As we are moving on to the Last week of the month this is not encouraging for the Traders. Foreign sales (1.5Bn this week, which was 2.1Bn last week) and purchases (617Mn of the last week improved to 1.4Bn during the week) took a positive turn. Higher number of Trades showed the bullish momentum by Traders. They were concentrating into one sector in particular and that is the Plantations. Traders who would want to be in the Plantation Sector need to make a note on the below mentioned key points as follows:

a). Sentiment effects that would bring due to wage hike.
b). Overbought levels in the Plantation Counters.
c). Month end de-liveraging that may happen.

We also can see that the number of counters that had over 100 trades during the week had increased from 29 to 49. Also the 300 trades and above counters were 18 from 10 counters of the previous week. Interestingly half of them came from one sector that is none other than the Plantation Sector.

JINS,BFN,CONN and DIAL moved out of the 300 club. That is one indication that those counters are now on a consolidation. KAPI is another that needs to see increased trades and volumes for a trend continuation, which will be covered below. HEXP performed well during the week, with volumes and trades, but will need a cooling off to move higher. LDEV is in a consolidation which is needed for a Trend Continuation. MGT needs to be collected at the present zone, as covered in the chart below. Sector chart of the Plantations is covered below which is an important chart to follow. It will be interesting to cover the counters in the plantations separately hence only the Sector chart is given here.

Let's look at the weekly charts of the ASI, PLT,LDEV,MGT and KAPI below:

ASI Weekly -

As mentioned above the Value of the Over all market has not improved during the week. ASI weekly in that back ground saw the bears trying to take control by bringing down the price line below the previous weeks low of 5962 to 5944, but was short lived. Bulls took the price line up quite decisively to close at 5978 after missing the 9EMA of 5996 by just 1 point. It will be a challenge for the bulls to defend their task during the week to follow as it will have face the month end selling. As long as 5944 which was the low of the week is defended the bulls can over power the bears and continue a trend into the new month.


Plantations Weekly -

We were expecting the price line of the PLT chart to test a resistance zone between 805 and 842 points. With a close at 820 the index has moved to the zone within a week. The 3 key points mentioned above will play a major role, thus a retracement before a Trend Continuation can not be ruled out.


KAPI Weekly -

As I have been saying for awhile now, trading KAPI is very easy if you watch the movement between 14/30 and 17/20. If 14/30 is broken down it will be short term bearish. !4/30 support and break out above 17/20 should happen within days for higher highs. Else the consolidation will panic many traders.


LDEV Weekly - 

Impulsive action that started at 6/40 and 4/80  could not hold as the trend failed on both occasions, however the impulse triggered at 4/00 survived to hold. The price is consolidating above that with a high of 4/70. If the said consolidation is to sustain above 4/00 with above average volumes, higher highs can be expected. Since the Price line is at the recent lower base levels, buying at the present levels between 4/40 and 4/60 will not be a bad idea, as long as you have a stop below 4/00.
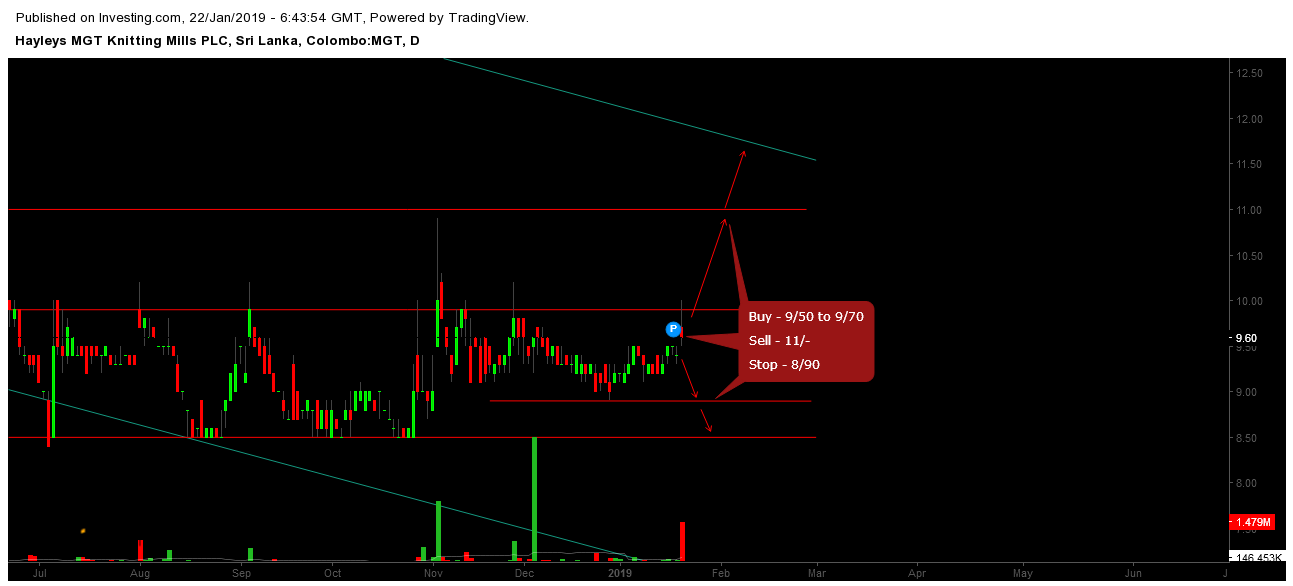


MGT Weekly - 

With improved quarterly figures, attention increased towards MGT. Do not see a huge short term upsurge until a strong base is formed between 8/90 and 9/70, with heavy volume absorption. If not for volumes this counter will not see higher highs. Do not ignore this counter at all. If the present growth is a continuous process we could see above average returns.


Thursday, January 24, 2019

Easy to Track ASI's direction

ASI just got above a critical descending line that has been a pivot on 14 times since June of 2017. Below the present close lays a support that had tested on three occasions at 5920, whilst at the top we see 6069 at a triple top. This shows that the index is trending in a rather solid channel between these 2 lines. Now that we have closed a touch above 5920 we need to see how best the bulls could take it up to test the triple top line, which just 80 points away. Present close of the ASI is 5960.


Wednesday, January 23, 2019

KAPI - What is going on?

Chart below shows how the price action is taking place in KAPI. Traders need to be aware of the Risk/Reward based on the period they are willing to hold. If someone wants the target to hit within a few days then waiting for a breakout of 17/20 with volumes will be sensible, with a stop loss at 14/70 (present swing low). For all bold traders who are willing to stop loss and are patient to wait for the Target of 19/=, can go ahead now itself. Target of 19/= will only be hit if the Volume based momentum is strong above 17/20.


Monday, January 21, 2019

MGT - Strong Quarter Results triggered the Bulls

Better than expected Quarterly performance brought positive sentiments into MGT today. Better than average volumes paves the way for a Trend Continuation which will retest 11/-, which was a level that was tested in November. Due to this bullish reversal, we can trade based on the Idea given below.

Buy - 9/50 to 9/70
Sell - 11/-
Stop - 8/90
Please stop the loss, without blaming anyone.


Plantations Trend reversal - Where will it go?

Many Plantation counters traded actively today compared to their performance during the last few weeks. We can see a bullish trend reversal in the sectoral chart. Lankem Developments who owns Agarapathana Plantations was the game changer on Friday the 18th. (Covered in the ASI weekly Report). This brought interest to many other plantations today. I give below the Charts pertaining to the Sector and the Counters as follows:

PLT -

Since the 3rd week of December 2018, there was a trend reversal in the Sector, which has now broken out of 750 points. It is now heading to test the resistance zone between 805 and 842. From the present close of 766 to 800 points there is room for growth. We need to see how successful the bulls are going to be to break out of 800 points. Need to see how it will perform.


LDEV - 

A volume of 1.046Mn shares traded today. More than a Million were absorbed between 4/50 and 4/60. This shows that there is a consolidation going on. As long as 4/50 is supported we will see new highs in the Counter.


MASK - 

MASK has seen a momentum change today. This needs to be defended to see higher highs. Need to wait for the momentum increase.


 MADU - 

Trend changed with an impulsive move. Need a strong build up. Accumulation between 6/50 and 7/50 is important for the counter to hit 8/80.


Sunday, January 20, 2019

DIAL - 9/90 had been a Pivot on 6 whopping occasions. Bullish Divergence on the Daily Chart

Someone mentioned that DIAL will give a return of 40%+ during 2019. Before grabbing it just because of that news let's keep a watch on the Monthly Price Action. Interestingly the Counter closed at an important pivotal support. 9/90 had been tested as a support/resistance on 6 amazing times. We are in that level again. Last time it had hit 9/90 was in March 2016, then hit had got reconfirmed in November of 2016, and rallied to a high of 14/80 in May 2018. That's a painful 27 months, sadly this rally got wiped out in a matter of just 8 months. As far as the monthly momentum is concerned the Bears are very much in control over the bulls. But to be fair by the Bulls there is a bullish divergence in the daily chart. As such you can not ignore a trade on this.

Trade Idea

Buy - 9/90
Sell - 11/20
Stop - 9/00

Stop is a definite rule. If your knees are jerking when the price fall there, you are not supposed to trade. You must avoid please!!!


HEXP - 92/00 was hit

A post on HEXP was shared on the 12th. The next working day was Monday the 14th Jan 2019. That was the ex dividend date for the counter. Those who were happy with the Dividend of 3/00 sold literally. They sold more than 6000 shares below 80/= and above 78/= the range recommended. Someone might say 'OH! only 6000?'. If so how much did you buy? 1 share or 1000 shares? This blog is not for Market Makers or Flamboyant big time traders. This blog serves to save and help Retail Traders who are the succours of the Sharks. Therefore any retailer who bought on this date would have seen the counter hitting the Target in 4 days (15th was pongal).

92/00 is the high that we saw in May 2017. Thereafter it took 13 months of consolidation to reach a low of 60/00 in July of 2018. Then in just 7 months the price checked in at 92/00. That was during the last week. If the price hit higher then we are moving into 2016 highs of between 95/00 and 104/50. Ideal Scenario is that We may not hit into that range immediately. But it will check in there, based on the level of consolidation. Consolidation above 85/00 would mean that we will see the said range been tested within weeks. But break below that and moving to 80/00 and towards 76/00, will prolong the consolidation. Must add that the price could test this range between 95 and 104/50 in euphoric price action, which we have seen many a times.

Trading at these levels won't be the ideal. Let's wait for the consolidation. For those who would want to trade first check the stop loss levels, and the volumes that you can easily move out as this counter is illiquid.


Saturday, January 19, 2019

AEL - Tripple bottom. Need weekly volumes over 1Mn

AEL has indicated in no uncertain terms that the 13/50 to 14/00 range has a very strong support. This can help the counter to move into an interesting rally. But only one thing is needed for that. That is the Volume. If you do not see volumes over a million weekly for a few weeks running the counter will be static like a rock. Look at the 20 week volume line in white at the bottom. It averages at over 2Mn weekly for the counter to really and beat the Bears. Nevertheless based on the strong support base, I suggest the trade idea given below.

Trade Idea

Buy - 14/00
Sell - 15/00 - 16/00
Stop - 13/50

Target Range is pretty narrow. But as mentioned above if the Volumes rise breaking out of 16/00 won't be hard. Hence you can use your discretion on the Targets, as long as you stick to your stop.
Please do not dilly dally on the Stop. Be bold in that. Trade as a smart trader!!! trade volumes that you can easily loose.


JINS - Can it respect 30/00?

JINS is a counter that had been in play for a while now. Price action is indicating that it is trying to move above an important level of 30/00. But if we do not see 30/00 is strongly supported during the next week, consolidation at the peak will bring fear to many traders. Who ever is buying now must have a stop loss at 29/00, otherwise please stay away. 

In my last weeks report on the ASI I suggested to enter between 29/00 and 30/00, with a stop at 27/90.  Those who bought must stop at 27/90 and below.

Caution!!! JINS is trying to get in to a newer range, but couldn't break out last weeks Red Candle, which is short term bearish.  Therefore STOP is a must at the prices given above.


SAMP - A new trend formed. Trade Idea!!!

The week just ended saw increased activity in SAMP. Both Trades and Volumes were higher than the previous week. Also the Price action was impulsive, suggesting that the counter is poised for a new up trend. Although the weekly candle was bullish and impulsive the momentum had just begun. The daily chart gives a better view of the Price action. We can now see that the counter is turning from a bearish momentum to a sideway movement as it is now trading through a channel between 217/30 to 245/=. That is a very wide channel. Who ever trades towards the middle and below range of it will make decent returns.

Trade Idea -

Buy - 225/00 - 230/00
Sell - 238/00 - 245/00
Stop - 223/10
Caution!!! Trade only what you can lose without complaining. If you are not disciplined to do so, please avoid trading.

If you do not get between 225/00 and 230/00 do not feel bad. If you still want to trade above 230/00, please know where to stop and where to exit before hand.


Friday, January 18, 2019

ASI - The Weekly Report.....Differently

The ASI had more activity during the week just ended. But the number of Stocks having trades of 100 or above dropped. The PE of the market increased to 9.57 from 9.51 which is another indication that the Market ticked higher. ASI closed at 5988 over the previous weeks close of 5967 a paltry 21 points for an entire week. However it may be the start of a trend reversal, if so the previous weeks low of 5963 must be supported. Turnover (3,439,399,285) was higher over the previous week (2,758,608,338), Volumes too increased from 45.2Mn to 53.2Mn. The number of Trades too shot up from 14,211 to 16,386, the Foreign number dropped though from 636 to 554. When you break down the Trades the number of Counters that counted over 100 trades dropped from 35 to 29. But over 300 trades the number was higher from 4 counters in the previous week to 10. If you further break it you'd notice that out of 10 over 300 trades counters, the over 600 trades counters had increased to 4 from 2 of the previous week. 

The list of 300 club for the last 3 weeks is given below


Stocks that stand out as you can see are BFN,LDEV and KAPI. Before we dig into there Price action, let me tell you not to ask WHY this is happening. Traders do not ask why this or that is happening. 

ASI Weekly -

Firstly I like to check the Weekly ASI. I have shared a post on the Monthly ASI which is not showing a momentum change. However the momentum in the Weekly chart is bullish. As long as the Trend won't break below the previous weeks low of 5963, the Traders need to focus on the uptrend. Values tried to penetrate 6000 yesterday, but failed. As can be seen the 9EMA is at 6001, thereafter the next resistance is at 6071. Blue chip counters too have helped the market, thus contributing to the bullish momentum.


BFN Weekly -

Now let's look at Orient Finance (BFN). Over 600k of shares traded within the week, which was above the average of the previous 2 weeks. Same is the case with Trades. It must be mentioned that the price SHOULD close above 16/00 for an uptrend in the next 3 to 5 days. Further Weekly Volumes must be over 500k and ideally over 1Mn if we are to see a trend above 16/00. 
Trade Idea

Buy - 14/- to 15/-
Exit - over 16/50 with a final target at 18/-
Stop - 13/30
Caution!!! - Trade volumes you can exit with ease. Do not blame others if you over expose. 


AAIC Weekly

AAIC was in the limelight during the last few weeks, same is the case during this week too. Price went over 47/50, which was the previous high, and tested a psychological price point of 50/00. Before the next move up the prices will consolidate. This consolidation needs to be above 43/00, to see newer highs tested within the next 1 to 2 weeks. Breakdown below 43/00 will nullify the uptrend momentum and go into a prolonged consolidation. During which time a de-liveraging action could bring it down to test the 9EMA at 40.80. As such have your stop below 44/00 upto 43/00. If you are confident of the fundamentals then avoid debt and wait.


LDEV Weekly

LDEV came into the limelight during the week. After hitting a low of 3/70 with lacklustre trading we saw more than 2Mn shares changing hands with 800+ trades. This will be a stock all traders will be focusing on during the next week. With a stop loss at 3/70 you can trade this at 4/50 and below. However your present target is a bit narrow between 4/80 and 5/10 ( Trade with aggression within 2 to 3 days prices could immediately take it upto 5/60, but odds aren't great) Therefore do not chase it, but wait for the price to come towards you. You need to trade volumes that you can tolerate, else do some other venture, as you will not be fit to trade.


KAPI Weekly

This brought windfalls to many and nightmares to many as well. But if you have been a professional/highly disciplined trader you know you have succeeded above all others. Now what?
Trading this is very simple. Do not touch until it breaks out of the present high of 17/20 with volumes on a closing basis. Do not try to collect at this point of NO MANs LAND. If the trend is weakening and indicates a consolidation, then the best thing is to stop loss between 14/50 and 15/00, and comeback once the consolidation is over.  But for those who never had a clue on ideal volumes to trade, the only saving grace will be to stay away from margins. 


I will close for now. However the balance in the list needs to be covered in the next day or 2. If someone can share their charts on the rest in the list it will be great. Nevertheless I will do it before the Sun goes Down on Sunday.


ASI - Can it break the 9 EMA of the Monthly Chart???

Exponential Moving Average Line had been helping the traders to watch the movements of the ASI quite effectively in the Monthly Chart. If you had just followed that you would have succeeded most of the time. As we can see in the chart below the present value of the Monthly 9EMA is roughly 90 points above the ASI line. Sad to say that the momentum is still not suggesting the ASI to break out of that level. However with 90 points away, there is hope. Conversely the ASI broke below the 9EMA in May 2018. Values have recovered since then to come closer to the EMA line. Despite the lack of momentum it will be interesting to watch the behaviour.


Monday, January 14, 2019

EAST - Potential Trade Target at 15/80

With the completed sale on Hunas Falls Hotel the momentum on other hotels have improved. EAST with the ownership of a Hotel, which was in the news not so long ago, drew Traders' attention towards the counter in addition to a few other Hotel stocks. As indicated in the Chart below the accumulation can be seen between 13.00 and 14.30, with the price candles during the past few weeks since the last week of October 2018 has trended up with higher lows. Up side break out must be a close above 14.30, and the trend cancellation will happen only when the counter closes below the present swing low of 11.90.
Positive momentum will take the stock up to test the resistance at 15.80, thus a trade should be targeted at that. Those who are interested for a trade can take positions between 13.00 and 14.30, with a target at 15.80, a failure of this trade should be stopped at 11.90. It is very important to expose to a trade volume that you can easily withstand a loss if the stop loss is triggered. Please keep that in mind when you are trading as a professional trader. If you are not a professional trader please do not trade. Have your hard earned cash safely parked in a bank.


Saturday, January 12, 2019

Trade BFL and GRAN based on the trend and Volumes

Since the Surprise drama that happened on the 26th October 2018, the poultry stocks too got into action.

BFL - Price line is ascending with volumes at above average levels as per the 20 day Volume line. After two weeks of HIGHER LOWS Prices took a consolidation during the week just ended. As such we need to watch the price action during the coming week. An important Price level to watch will be 121.00 which got supported in the 2nd week of December quite strongly. As the volumes are satisfactory watch the price behaviour before initiating an entry.


GRAN - Prices are holding up in an ascending pattern, yet this stock will never move up without volumes. Could trade at the lower end of the zone with tight trading with a close focus on the volumes.  Average weekly volumes over 500k is a must to bring a lot of attention to the counter. If we do not see volumes the stock could breakdown below the 9 ema of 59.80.


HEXP - You need to be in this counter

One of the frequently traded Stocks with over 100 trades in 2 consecutive weeks is HEXP. This has been a long standing export companies in the Country and with a strong Dollar the expectations are high. As we are moving towards the Earnings Season of the December Quarter, Traders can not stay out on this. Only negative factor in this stock is the lack of liquidity, so you need to trade with volumes that you can easily get out in case you have to Stop Loss. Don't blame others but you if you over expose to this stock as a Trader.

This stock needs to close above 82.00 in the next few days and move towards 92.00. Initiate your entry between 78.00 and 80.00, with a stop at 72.50. Your 1st Target is at 92.00. If we see a Profit Growth then it could penetrate the resistance range of 2016 between 95.00 and 104.50, and new highs thereafter.


Friday, January 11, 2019

ASI - A Weekly report with a difference

Weekending 11th of January 2019, the Market PE dipped to 9.51 against 9.67 in the previous week. The PBV dropped to 1.16 times from 1.18 of the previous week. However the Number of Trades increased to 14,211. It was 13,427 in the previous week. If you break the trades number down you will see that both domestic and foreign participation edged up at the close of this week. The number of Domestic trades nudged up marginally from 13,427 in the previous week to 13,575 this week, whilst the foreign side climbed from 367 trades to 636 trades during the week. While this has been the Trading overview of the ASI, let's look at the mostly traded Counters during the week vis a vis the previous week.

There had been 32 counters that saw over 100 trades in the week ending 4th of Jan 2019, which had increased to 35 by the close of this week. Out of these counters 18 had seen trades over 100 in both weeks. Breaking it down further you would see that there are 4 counters that had seen trades over 300 during these 2 weeks, with JINS seen only 293 trades this week, but had 727 trades during the last week, hence included into the over 300 club. The 4 counters that are in the 300 club are as follows:

                                        Previous Week                      This Week
JINS                                       727                                      293
SAMP                                    429                                     1267
AAIC                                   1048                                      356
HUNA                                   516                                       803

There is no point questioning the pros and cons as to why these 4 counters were specially treated in terms of Trades, but worth having a look at their price action which could help us to Enter or Exit them.

JINS - Presently trying to defend 30.00. If a consolidation is to take place it needs to strongly support 27.90 which is the 9 EMA. If the bulls want to really succeed then 1st the present downtrend line needs to be broken and head over 33.50. If we do not see the 33.50 is defeated then unfortunately the bullish expectations will not realise. If they succeed then a target of 38.00 can be expected. The Traders can certainly enter based on the present price behaviour. As long as you are prepared to stop loss at 27.90, you can go ahead to collect between 29.00 and 30.00.


SAMP - Zone between 210.00 and 224 had been a long consolidation in 2016, which lasted for a whopping 23 weeks. We have now come to that zone again after hitting a high of 319.50. This is not for traders. But for long term investors it will be a sure counter to collect on weakness.


AAIC - During the last week of 2018 we saw the counter breaking out of the 2011 high of 40.50. This must be defended for the prices to move higher. On the 1st week of 2019 AAIC hit a new high of 47.50. Obviously this must be broken out if we want to see newer highs. Hence a consolidation above 40.50 is a must. Therefore you have to keep a stop at 40.50 if you want to trade at the present price levels. For those who would want to be on the defensive, wait to see if the prices would retrace to 40.50.


HUNA - This is a no brainer now, as the stock will definitely hit 187.00 as there will be a mandatory offer at this price. No right thinking shareholder will ever sell the share below 187 in this background. Mondays trading pattern will certainly help the traders. If you can grab it below on Monday the 14th Jan 2019, you must certainly do. Good Luck.


Let's check the rest of the interesting counters later.


Saturday, January 5, 2019

ASI - Must break 6073 to test 6100 to 6120

ASI ended the 1st week of 2019 with a positive note for the traders and caution for Investors. All Share need to break the high of Thursday the 3rd of 6073 points to test 6100 to 6120, else a retracement will bring it down towards 5998 to 6000 points.


Loss and Gain of the ASI in 2021 vs the Loss in 2022

  This ASI chart shows the All time high in 2021 of 9025.82 on the 29th 0f Jan'21 and the fall to the yearly low of 6852.64 on the 19th ...