The most difficult act to master in trading is the Stop Loss. The fear of loosing money when you stop the trade is the biggest reason to avoid the stop loss. But as you can see in the list of stocks I have been recommending, I have indicated the stocks that I have stopped.
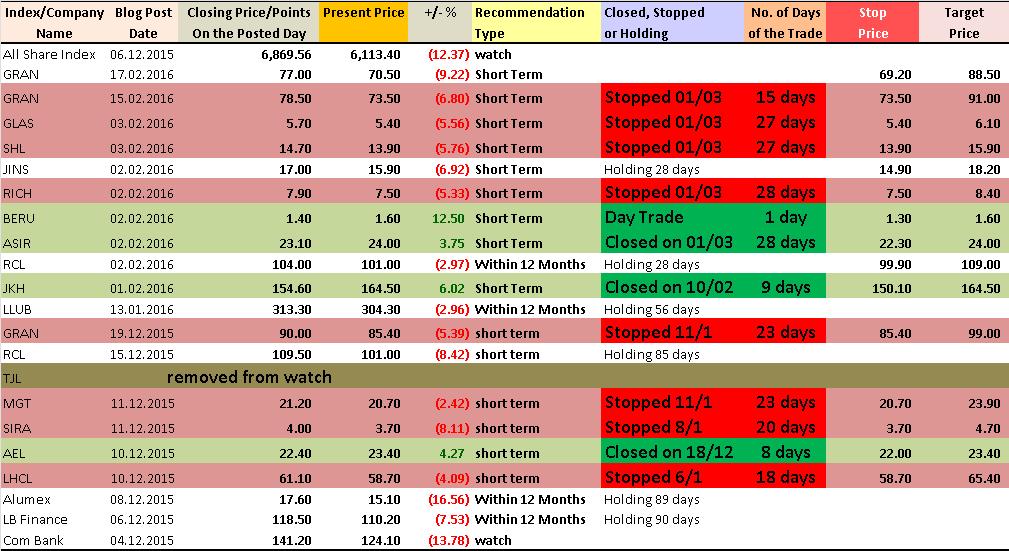
The above chart shows you the list of stocks I have been posting, and the status of them. There had been 14 short term trades that I've given, and out of which 8 were stopped, 3 were closed at the target price, 2 are still holding, and 1 was a Day trade.
If you calculate the trades that were concluded with gains and losses the following will be the outcome:
Total number of profit trades = 3 closed at the target price and 1 day trade = 4 trades.
Total cost for the purchases with the brokerage cost = 203.15
Total cost of the sales including brokerage = 211.75
Total Profit = 8.60
Total number of trades stopped at a loss = 8
Cost for the purchase including the brokerage = 285.42
Cost of sales including the brokerage = 266.60
Total Loss = 18.83
Total cost of both purchases = 203.15 + 285.42 = 488.57
Total Cost of Both Sales = 211.75 + 266.60 = 478.35
Total Loss = 488.57 - 478.35 = 10.22
Loss as a % of the purchase cost - 10.22/488.57*100 = (2.09%).
Planning the trade and trading the plan is very important if your culture is to trade in the Stock Market. Else stay out of trading, and look for something else to put your money into. Perhaps buying and selling toffees.


No comments:
Post a Comment