Colombo Stock market ended the week with an extension of the trend further. On the 16th of May '19, the ASI reported the present low of 5198.95. Market ended on Friday with a close of 5715.14. But the intra-day high was 5724.13. 16th of May to the 19th of July'19 there had been 44 market days, and the ASI has shown an increase of 524.18 points, almost 12 points a day. Previous run of this type was in 2017, from the 28th of March 2017 to 14th of July 2017. During a period of 70 days the ASI went up from a low of 5968 to a high of 6769, which is an increase of 801 points. That is an average of 11.4 points a day. We see in 2016, that the market increased by 916 points in 43 days, with an average of 21 points.
During these 3 phases of the ASI within these 3 years, it is interesting to see what happened to the RSI.
In 2016 rally the RSI extended from a low of 11.6 points to a high of 83.1. As shown in the following chart covering this period, you will notice how the RSI has slowed down as against trend extension of the ASI.
In 2017 rally, where the index increased by 801 points in a total of 70 days, the RSI increased from a low of 24.6 points to a high of 83.6 in just 11 days from 28th of March to the 12th of April. In this period the index went up from a low of 5968 to a high of 6421 points. The 2nd phase starts at a low of 6351 on the 18th of April 2017, and increased to a high of 6769 points. But the RSI went down from a high of 83 points to close at 56 points. This is known as a bearish convergences show an in the following chart.
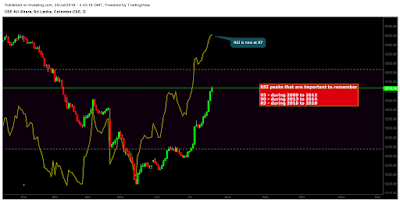
The week ended on the 19th instant the RSI closed at 87 points. However the RSI peaks since 2009 todate have been around 83, 90 and 93. Hence the 87 is only above 83 points, which was the highest during 2016 to 2018 period. The following chart shows that. This can be called the 1st phase of the present trend.
The number of trades that recorded during the week just ended was 30,418 against a figure of 22,778. This shows the bullish sentiment that is visible in the market. The number of counters with over 300 trades increased too, from 15 to 21 during the week. Counters with 500+ trades edged down to 8 from 10 over the previous week. There were 2 counters with 1000+ trades, out of which AEL saw 1000+ trades for the 3rd week in a row. The other was BIL with renewed energy and hope.
For those who want to follow the herd and rumours, NO ONE CAN HELP. We have to commend the ones who are risking millions of rupees and acting as UN OFFICIAL MARKET MAKERS. They too need exit strategies, but the past experience have suggested to us that these TREND SETTERS, either get branded as manipulators or get caught for forced selling due to them being compelled to defend and keep the euphoric momentum they themselves are creating.
For the desciplined traders and investors who are manoeuvring within these undercurrents, will certainly see great opportunities, that can be turned into moments of glory!!!


No comments:
Post a Comment